SEO Forecasting in 2026: How to Build a Traffic Model You Can Actually Defend
The standard SEO forecast multiplies borrowed search volume by a borrowed CTR curve, and both were calibrated on a results page that no longer exists. Here is the 2026 model: calibrate your own curve from Search Console, split AI Overview traffic from clean SERPs, apply a ramp, and ship a range you can reconstruct six months later.
Contents
- Why most SEO forecasts stopped working
- The two borrowed inputs nobody checks
- Calibrate the CTR curve on your own data
- Split the forecast by SERP type, not just position
- The model, written out
- Ship a range, then defend the range
- What you can forecast and what you cannot
- A 90 minute forecast build
- Five ways a forecast fails in review
- Where MarqOps fits
- Frequently asked questions
- The bottom line
Why most SEO forecasts stopped working
SEO forecasting has a credibility problem, and it is not because forecasting is inherently unreliable. It is because the two numbers that go into almost every forecast were both quietly invalidated over the last two years, and most models kept using them anyway.
Open any forecasting template and you will find the same arithmetic. Take a keyword's monthly search volume from a third-party tool. Multiply it by a published click-through rate for the position you expect to reach. Sum across the keyword set. Apply a conversion rate. Print a revenue number. That model was reasonable when a search results page was ten blue links and a couple of ads. It is now describing a page that most searchers do not see.
Seer Interactive's tracking of AI Overview impact found organic click-through rate on affected queries falling by roughly 65% over fifteen months. Pew's independent analysis put the relative decline closer to 47%. Ahrefs measured a 58% drop for position one specifically. The studies disagree on magnitude, which is normal for behavioral measurement across different query samples, and they agree completely on direction.
The finding that should actually change how you model is quieter. Seer also measured queries where no AI Overview appeared at all, and those were down about 41% year over year. If clean SERPs are eroding too, then swapping in an "AI Overview adjusted" curve and calling it fixed is only half a correction. Search behavior shifted, not just search layout. We covered the mechanics of that shift in more detail in our guides to AI Overviews and zero-click search.
ALM Corp's February 2026 vertical analysis added the commercial dimension: classic organic click share fell between 11 and 23 percentage points across every vertical measured, while text ads picked up 7 to 13 points in every category. Traffic did not evaporate. Some of it moved to a channel you have to pay for.
The two borrowed inputs nobody checks
Before you can fix a forecast you have to be honest about where its numbers came from. In almost every case, two of the three inputs are estimates produced by someone else for a different site.
| Input | Where it usually comes from | What it actually is | What to do instead |
|---|---|---|---|
| Search volume | Ahrefs, Semrush, Keyword Planner | A modeled estimate from clickstream panels and Keyword Planner ranges, rounded and smoothed | Cross-check against your own Search Console impressions for terms you already rank for |
| CTR by position | A published industry curve | An average across sites, verticals, brands and SERP layouts that have nothing to do with yours | Build your own curve from 16 months of Search Console data |
| Rank trajectory | An assumption stated as a fact | The single largest source of error in the model | Model it as a ramp with a stated confidence level, never as a fixed endpoint |
| Conversion rate | Site average or an industry benchmark | Usually blended across branded and non-branded traffic, which inflates it | Segment to non-branded organic only, from your own analytics |
On search volume, the accuracy picture is better than the skeptics claim and worse than the tools imply. Comparative studies against Search Console impressions have found Ahrefs roughly accurate for about 60% of keywords tested, and Semrush matching exactly on around a third. That is useful for prioritization and dangerous for arithmetic. A cluster-level total will land in the right neighborhood. A single keyword's number should never be the basis of a revenue promise.
The deeper issue is that search volume and impressions are not the same measurement. Volume counts queries. Impressions count times your result was actually rendered for a user, which already accounts for personalization, SERP features, device mix and how far down the page anyone scrolled. Your impressions are measured. Their volume is modeled. When the two disagree, the measured one wins.
Calibrate the CTR curve on your own data
This is the step that separates a forecast that holds up from one that does not, and it takes about twenty minutes.
Export Search Console performance data at query level for the last 16 months, with clicks, impressions, CTR and average position. Sixteen months gives you the full available window plus a year-over-year comparison. Then do four things with it.
Bucket by position, not by rank. Average position in Search Console is a decimal average across impressions, so bucket into 1.0 to 1.5, 1.5 to 2.5, and so on. Calculate impression-weighted CTR per bucket. That is your curve.
Split branded from non-branded. This matters more than any other segmentation. Published 2026 data puts branded position one CTR at around 56.4% against 24.8% for non-branded, a gap of more than 2.2x. If your curve is blended and your forecast targets non-branded terms, every number in it is too high. Our piece on share of search covers why branded and non-branded demand also need to be tracked as separate signals.
Flag which queries trigger an AI Overview. Search Console does not label this, so you need a rank tracker or SERP API pass over your priority set. Estimates put AI Overviews on roughly half of searches now, and the distribution is heavily skewed toward informational intent, so a top-of-funnel content plan and a bottom-of-funnel one need different curves entirely.
Discard buckets with thin data. Any position bucket with fewer than about 1,000 impressions is noise. Fill those from a published curve and mark them as borrowed, so the assumption is visible when someone reviews the model.
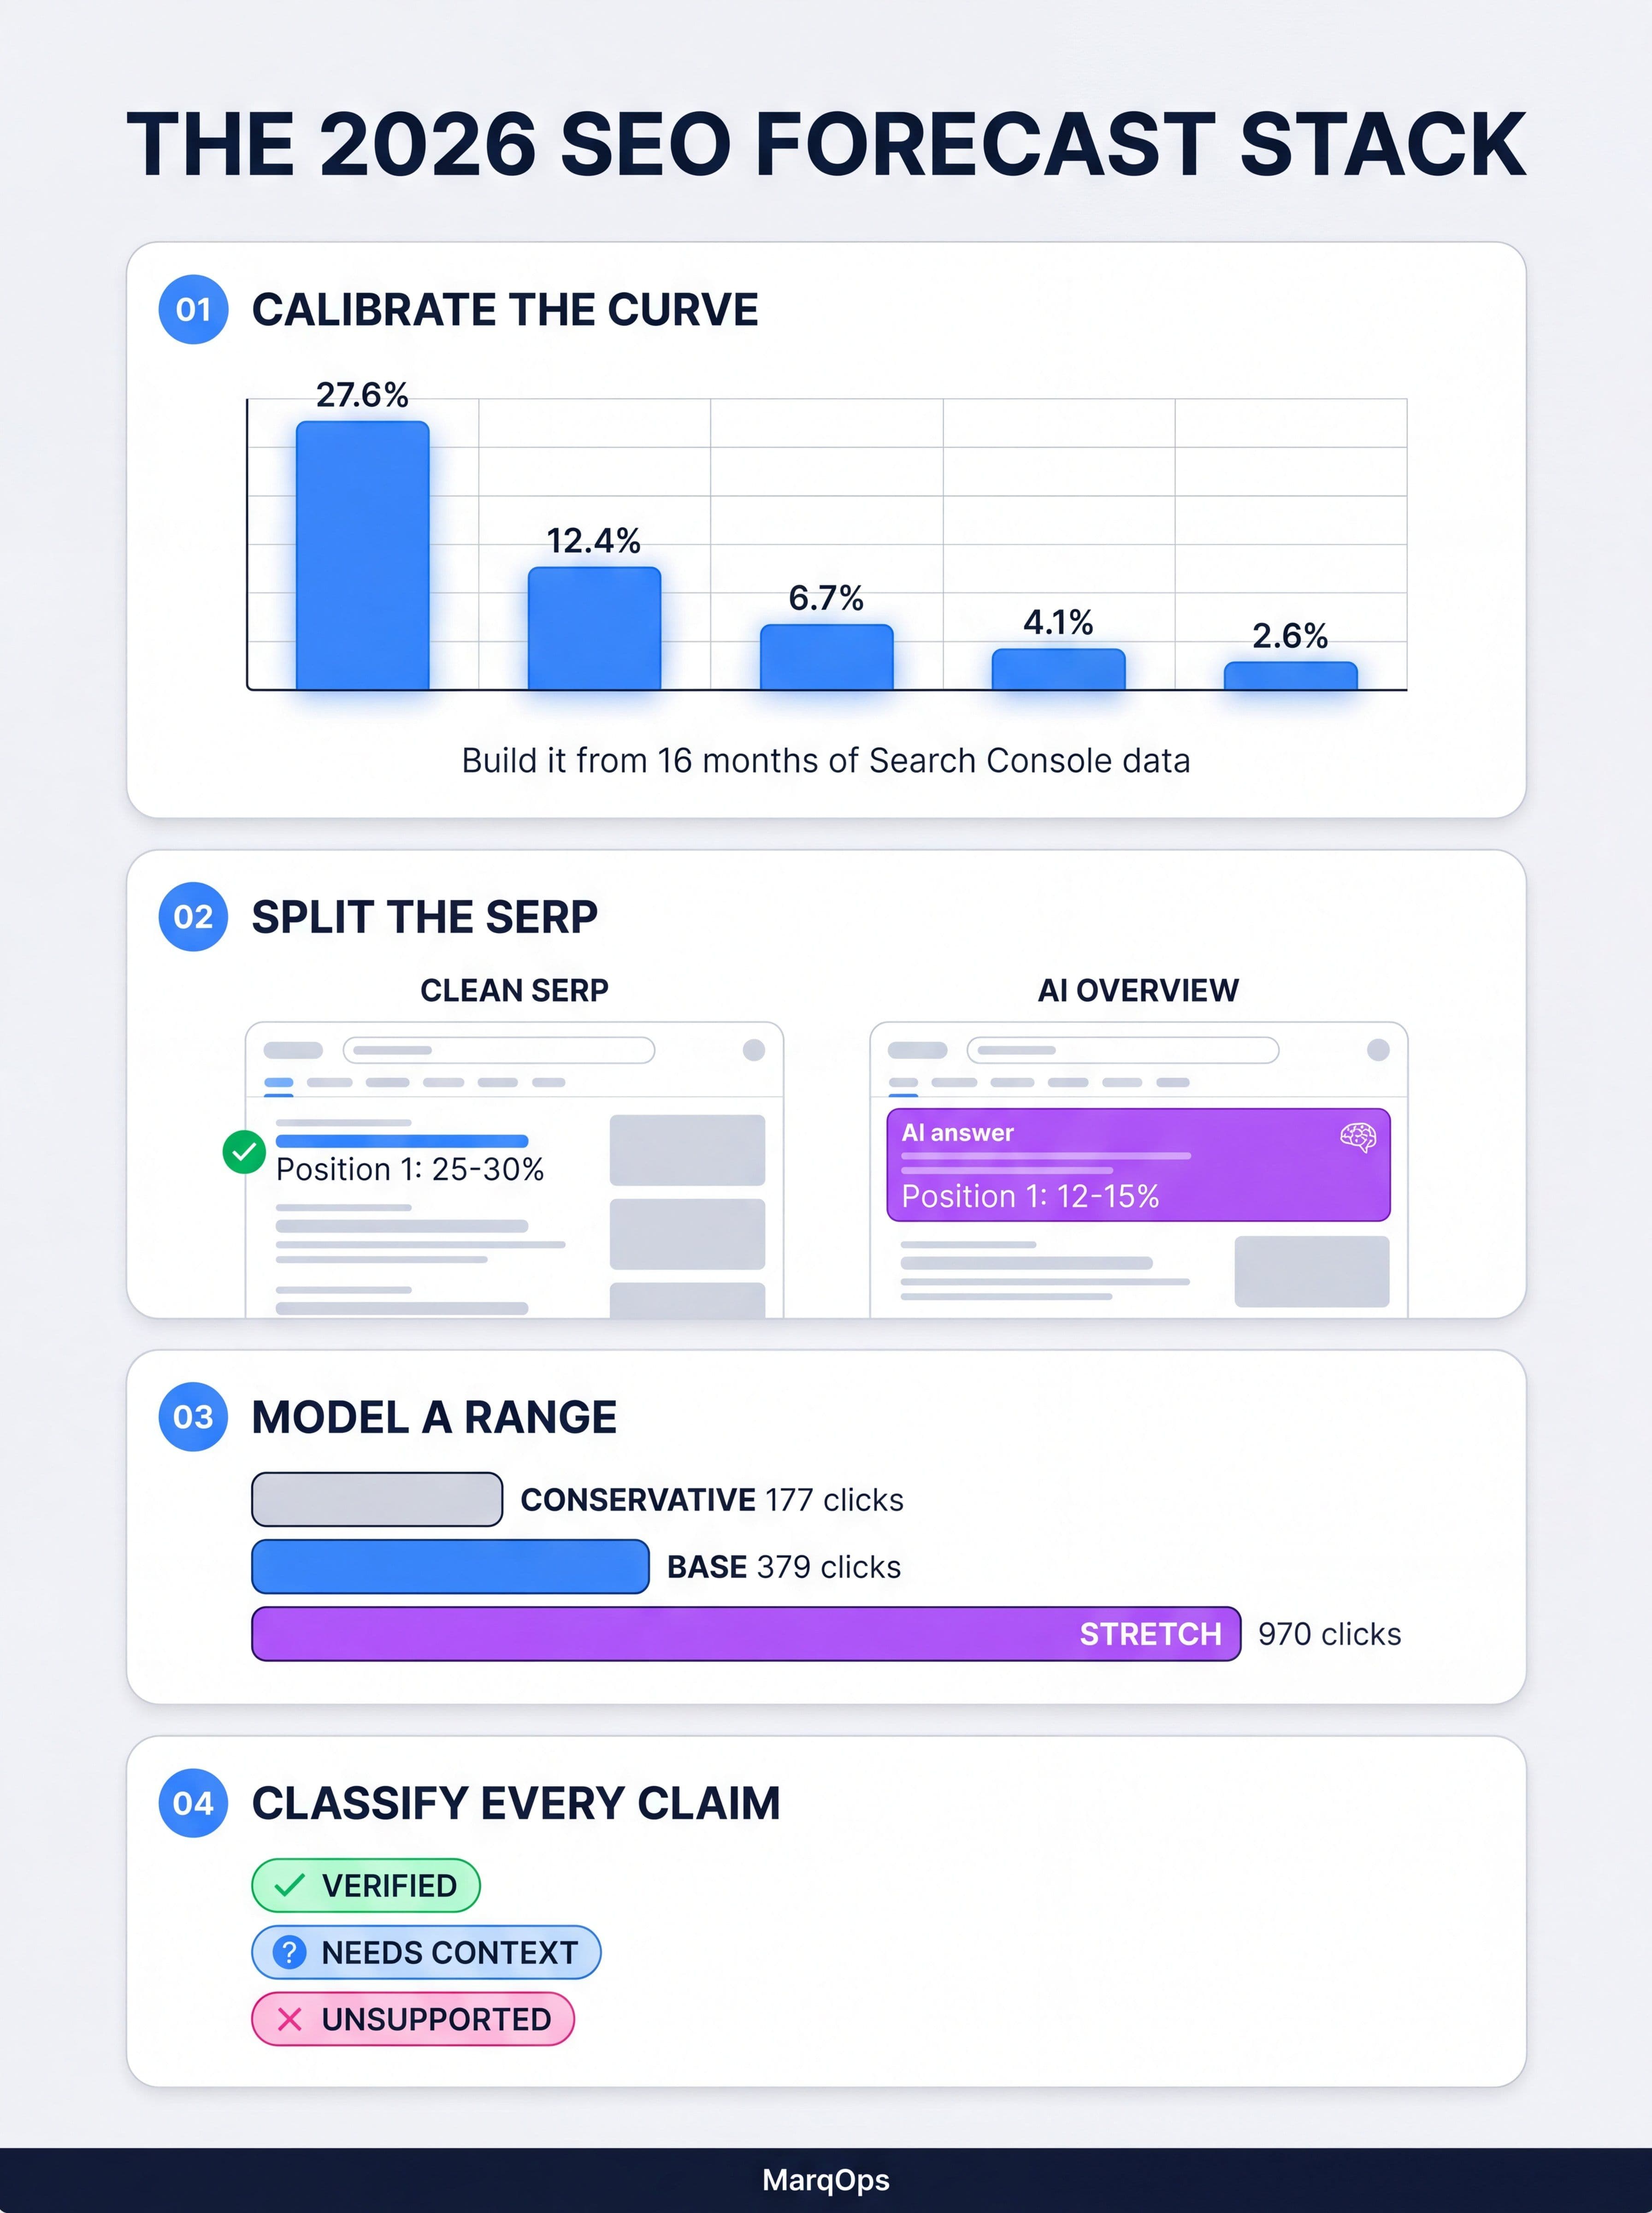
The 2026 SEO forecasting stack: calibrate the curve, split by SERP type, model a range, then classify every claim before it reaches a client.
Split the forecast by SERP type, not just position
Position is no longer a sufficient description of an opportunity. Position three on a clean results page and position three underneath an AI Overview are different products with different economics, and averaging them produces a number that describes neither.
| Position | Blended 2026 CTR | Clean SERP, no AI Overview | AI Overview present |
|---|---|---|---|
| 1 | 27.6% | 25% to 30% | 12% to 15% |
| 2 | 12.4% | 12% to 18% | 5% to 8% |
| 3 | 6.7% | 7% to 12% | 3% to 5% |
| 4 | 4.1% | 4% to 7% | 2% to 3% |
| 5 | 2.6% | 3% to 5% | 1% to 2% |
| 6 to 10 | 0.78% to 2.1% | 1% to 2.5% | 0.4% to 1% |
Read the right-hand column carefully, because it changes prioritization and not just arithmetic. On an AI Overview query, moving from position five to position three is worth a couple of percentage points of CTR. On a clean SERP the same move is worth four to seven. If half your target cluster triggers an AI Overview, the effort you spend climbing on those terms buys materially less traffic than the same effort spent on the clean half.
That is a strategy conclusion hiding inside a forecasting exercise, and it is the reason keyword clustering should happen before forecasting rather than after. Cluster first, tag each cluster by SERP composition, then forecast each cluster on its own curve.
One caution on the AI Overview column: it is moving. AI Overview present CTR recovered from about 1.3% in December 2025 to 2.4% in February 2026 in Seer's tracking. That may be Google tuning link placement, it may be users adapting, and either way a number that nearly doubles in two months is not a constant. Date-stamp it in your model and revisit it every quarter. The same discipline applies to Google AI Mode, which is on a separate and much earlier measurement curve.
The model, written out
Here is the full calculation, with every multiplier named so it can be argued with:
The ramp factor is the piece most models skip. Content published in month one does not rank at target in month one. A workable default for a site with existing topical authority is 0% for months one and two, then 15%, 35%, 60%, 80% and 100% of target position CTR across months three through seven. A new domain should stretch that across ten to twelve months. State the ramp explicitly, because it is the assumption most likely to be wrong and the one clients most want to see.
A worked example. Say the target cluster holds 62 keywords and 18,400 combined monthly searches, and a SERP sweep shows 34% of that volume triggers an AI Overview. Current average position is 14. Three scenarios at steady state, after ramp:
| Scenario | Target position | Clean SERP clicks | AI Overview clicks | Total monthly clicks | Monthly revenue at $4,200 ACV |
|---|---|---|---|---|---|
| Conservative | 8 | 146 | 31 | 177 | ~$2,900 |
| Base | 5 | 316 | 63 | 379 | ~$6,300 |
| Stretch | 3 | 814 | 156 | 970 | ~$16,100 |
Revenue assumes a 1.8% non-branded organic conversion rate and a 22% lead-to-customer rate, both pulled from the account's own trailing twelve months rather than from a benchmark. The spread between conservative and stretch is 5.5x. That is not a failure of the model. That is the honest width of the uncertainty, and hiding it behind a single midpoint is how forecasts lose credibility in month six.
If you want the revenue side of this to be defensible on its own, the input that deserves the most scrutiny is the conversion assumption. Our guides to customer acquisition cost and AI marketing ROI go deeper on separating channel-attributed revenue from revenue that would have arrived anyway.
Ship a range, then defend the range
Presenting three scenarios is easy. Getting a range accepted instead of being asked for "the real number" is the harder part, and it is mostly a framing problem.
The framing that works is to attach each scenario to a condition rather than to a mood. Conservative is not pessimism. It is what happens if you publish on schedule and nothing else goes your way: no additional links, competitors keep shipping, AI Overview coverage expands on this cluster. Stretch is not optimism. It is what happens if a specific set of named things all land. Write those conditions down next to the numbers.
That statistic is the commercial case for the whole exercise. Gartner's spend research has marketing budgets flat at around 7.7% of revenue, with 39% of surveyed CMOs planning to cut agency spend. In that environment the forecast is not a sales document. It is the thing you will be measured against, and a number you cannot reconstruct in six months is a liability rather than an asset.
Practical rule: whatever range you publish, commit to a monthly variance review against it. Track forecast versus actual as its own line in the report. Being 30% under on the base case is a manageable conversation when the variance has been visible since month two. The same 30% discovered in a quarterly business review is a different meeting entirely, which is a lesson agencies usually learn the expensive way. Our white label SEO reporting playbook covers how to build that variance line into a recurring client report.
What you can forecast and what you cannot
A useful discipline borrowed from claim review: before a forecast leaves your hands, classify every line in it. Verified means it is traceable to a source you can show. Needs context means it is a reasonable estimate with a stated assumption attached. Unsupported means you cannot defend it and it should not ship.
| Forecast component | Classification | Why |
|---|---|---|
| Current impressions, clicks, position | Verified | Measured in Search Console, reproducible on demand |
| Calibrated CTR curve from your own data | Verified | Derived from measured data, with the derivation saved |
| Third-party search volume | Needs context | Modeled estimate, accurate at cluster level, unreliable per keyword |
| Target position and ramp timing | Needs context | An assumption with a stated basis, not an outcome you control |
| AI Overview CTR multiplier | Needs context | Moving quarter to quarter, date-stamp the source |
| "This will generate $X in revenue" | Unsupported | Causal claim about an uncontrolled system, state as a modeled range |
| Competitor response and algorithm updates | Unsupported | Not forecastable, name as a risk instead |
The last two rows are where forecasts get people in trouble. Turning a modeled range into a causal revenue promise is the single most common way an SEO engagement ends badly, and it is entirely avoidable with a sentence of framing. If you need to isolate real causal impact rather than model it, that is an incrementality testing question, not a forecasting one.
A 90 minute forecast build
Assuming you already have the keyword set, this is the sequence:
Minutes 0 to 20. Build the curve. Export 16 months of Search Console query data. Bucket by position, split branded and non-branded, calculate impression-weighted CTR per bucket, discard anything under 1,000 impressions. Save the tab.
Minutes 20 to 35. Tag the SERP. Run the priority keywords through a rank tracker or SERP API and record which trigger an AI Overview, which have an ads block above the fold, and which show a featured snippet. Calculate the AI Overview share of cluster volume.
Minutes 35 to 50. Sanity-check volume. For every keyword you already rank for, compare third-party volume against your actual Search Console impressions. If the tool is systematically running 40% high across your set, apply that correction factor to the keywords you do not yet rank for.
Minutes 50 to 70. Run the three scenarios. Apply the calibrated curve at three target positions, split by SERP type, with the ramp applied month by month. Do not blend. Keep clean and AI Overview volume in separate columns so the composition stays visible.
Minutes 70 to 85. Classify and annotate. Label each line verified, needs context, or unsupported. Write the condition attached to each scenario. Name the risks you are not modeling.
Minutes 85 to 90. Set the variance review. Add forecast versus actual as a permanent row in the monthly report and put the first check-in on the calendar. If your reporting already runs through a unified marketing dashboard, this is a single new row rather than a new process.
Two upstream dependencies are worth confirming before any of this. If pages cannot be crawled or rendered, the ramp assumption is fiction, so run the technical SEO audit checklist first. And if the cluster overlaps content you already have, a content audit will usually find that the fastest gains are in updating existing pages rather than in publishing new ones, which changes the ramp curve considerably in your favor.
Five ways a forecast fails in review
Blended CTR on a non-branded plan. The most common and most expensive error. Branded terms inflate the curve by more than 2x at position one and the plan never touches them.
Position one as the target. Forecasting to position one for a cluster currently sitting at fourteen is not ambitious, it is unfalsifiable. Target the position your own historical movement data says is reachable in the timeframe.
Volume totals with no impressions cross-check. If you rank for even a handful of the terms, you have measured data available to calibrate the modeled data. Not using it is a choice.
No ramp. Steady-state numbers presented as month one numbers guarantee a difficult month three. The ramp is also the part clients find most reassuring, because it shows you have thought about time.
Traffic forecast with no traffic quality assumption. Clicks are not the deliverable. A cluster that doubles traffic and halves conversion rate has cost you something. Forecast the conversion assumption alongside the click assumption, and tie both back to the marketing KPIs the business is actually managed against.
Where MarqOps fits
MarqOps was built around a narrow idea: the claim a client reads should be traceable to the source data behind it, and a human should approve it before it ships. Forecasting is where that idea earns its keep, because a forecast is a claim about the future and it is the claim clients remember longest.
Analytics Ops connects Search Console and GA4 so the calibration inputs come from measured account data rather than a screenshot pasted into a deck, and lets you ask a plain-language question with the source view one click away. SEO Ops carries the same evidence trail from research through brief to published content, so the ramp assumption in your model and the publishing schedule that has to deliver it are the same object rather than two documents that drift apart. Verified reporting then runs each material claim through a review that classifies it as verified, needs context, or unsupported, and blocks the unsupported ones from delivery. That is the same classification discipline described above, applied automatically to every report that leaves the platform.
MarqOps sits above whatever dashboard you already use rather than replacing it. Plans start at $19 per month with a seven day trial and no credit card. If you want to see the mechanics before signing up, the interactive sample report shows evidence receipts on a live example, and verified client reporting walks through the claim review flow. For the technical inputs that feed the ramp assumption, the free SEO and Core Web Vitals audit and the free SEO audit checklist are both open.
Frequently asked questions
What is SEO forecasting?
SEO forecasting is the practice of modeling how much organic traffic, and usually how much revenue, a set of pages or keywords is likely to produce over a defined period. A credible model combines search demand, a click-through rate curve calibrated on your own data, a target ranking position with a ramp over time, and conversion assumptions taken from your own analytics rather than from industry benchmarks.
How accurate is SEO forecasting in 2026?
Accurate enough to plan with, not accurate enough to promise with. Cluster-level click forecasts built on calibrated data typically land within the conservative-to-stretch band rather than on the midpoint, which is why publishing a range beats publishing a number. Single-keyword forecasts are considerably less reliable, because third-party search volume is a modeled estimate and rounding at the keyword level is significant.
Do I need an SEO forecasting tool?
Not for the model itself. A spreadsheet handles the arithmetic, and the quality of the forecast lives entirely in the inputs. What you do need is access to 16 months of Search Console data, a way to check which of your target queries trigger an AI Overview, and a keyword source for demand estimates. Most dedicated forecasting tools are packaging those three inputs plus a published CTR curve you should be replacing anyway.
How do AI Overviews change the forecast?
They require a second CTR curve. Measured click-through rates on AI Overview queries run roughly 40% to 60% below equivalent positions on clean results pages, and the effect concentrates on informational intent. Tag which share of your cluster volume triggers an AI Overview, forecast the two halves separately, and re-check the multiplier quarterly, because it has moved noticeably in early 2026.
How far out should an SEO forecast run?
Twelve months is the practical ceiling for a site with existing authority, and six is often more useful. Beyond a year the compounding error in the rank trajectory assumption swamps everything else in the model. If a longer horizon is required for budgeting, present it as a range that widens with time rather than as a line that keeps climbing at the same slope.
What should I do when the forecast is missing?
Diagnose before you re-forecast. Check whether the miss is in rankings, in click-through rate at achieved rankings, or in conversion. A ranking miss is a content and authority problem. A CTR miss at the right position usually means the SERP changed underneath you, which is a title, snippet and AI Overview question. A conversion miss means the traffic arrived and the page did not do its job, and it has nothing to do with the forecast at all.
The bottom line
SEO forecasting did not become impossible. It became a discipline that punishes borrowed inputs. The tools that got you a defensible number in 2022 are handing you the same number in 2026 while the results page underneath it has changed shape twice.
The correction is unglamorous and it works. Build the click-through rate curve from your own Search Console data. Split branded from non-branded and AI Overview from clean. Cross-check modeled volume against measured impressions. Apply a ramp instead of a switch. Publish three scenarios with the conditions attached, classify every line as verified, needs context, or unsupported, and put forecast versus actual into the monthly report so variance is a conversation rather than a surprise.
None of that makes the future predictable. It makes your reasoning inspectable, which is the thing that actually survives a budget review. In a year where budgets are flat and agency spend is the first line under the knife, the forecast you can reconstruct on demand is worth considerably more than the one that looked better in the pitch.
Keep following the signal
Related field notes
Marketing Operations
Marketing Project Management Software in 2026: How to Choose Without Adding Tool #122
11 min readMarketing Analytics
Marketing Attribution Software in 2026: The Buyer's Guide for a Stack That Won't Stop Growing
11 min readMarketing Operations