TL;DR
- Incrementality testing measures the sales your marketing actually caused, filtering out conversions that would have happened anyway. It answers the only question that matters: what did this spend truly drive?
- Privacy changes erased 30 to 40 percent of trackable conversions, and 73 percent of marketers now distrust their attribution data. That is why 52 percent of US marketers already run incrementality tests.
- Platforms like Meta and Google over-attribute by 20 to 60 percent. True incremental ROAS is often 30 to 60 percent below the number in your ad dashboard.
- The main methods are geo holdouts, audience holdouts, ghost ads (PSA tests), and time-based tests. Each isolates causal lift differently.
- The smartest 2026 setup is triangulation: incrementality testing to validate, marketing mix modeling for the big picture, and attribution for day-to-day optimization, all unified in one place.
Table of Contents
- What Is Incrementality Testing?
- Why Incrementality Testing Matters More in 2026
- Incrementality vs. MTA vs. MMM
- The 4 Core Incrementality Testing Methods
- How to Calculate Incremental Lift and iROAS
- How to Run an Incrementality Test: 7 Steps
- 2026 Benchmarks and What Good Looks Like
- 5 Common Mistakes to Avoid
- Where MarqOps Fits: Triangulated Measurement
- Frequently Asked Questions
What Is Incrementality Testing?
Incrementality testing is a measurement method that isolates the sales, signups, or conversions your marketing actually caused, separate from the ones that would have happened with no advertising at all. In plain terms, it answers a deceptively simple question: if you turned this campaign off, how much revenue would you actually lose?
Most marketing reporting cannot answer that. Your ad platform happily claims credit for a purchase the moment someone clicks or even sees an ad, but a large share of those buyers were already heading to checkout. Incrementality strips out that noise by comparing a group exposed to your ads against a statistically identical group that was held back. The gap between the two is your incremental lift, the true causal impact of the spend.
This is a different discipline from the click-path reporting most teams grew up on. If you have read our guide to multi-touch attribution, think of incrementality as the validation layer that tells you whether those attributed conversions were real or just correlation dressed up as cause.
Quick definition: Incrementality is the measurable difference in outcomes between a group exposed to a campaign and an equivalent control group that was not. If both groups convert at the same rate, your incremental lift is zero, no matter how much credit the platform took.
Why Incrementality Testing Matters More in 2026
For a decade, marketers leaned on user-level tracking to follow people across sites and stitch together attribution. That world has quietly collapsed. Third-party cookies, App Tracking Transparency, and walled-garden data limits have gutted the signal that platform attribution depended on. Privacy changes have erased an estimated 30 to 40 percent of previously trackable conversions, and fewer than 40 percent of marketers say they can accurately measure overall marketing ROI.
The trust gap is just as stark. A 2025 eMarketer study found that 73 percent of marketers distrust their attribution data, and that number has only climbed since. When the dashboard says one thing and the bank account says another, teams stop trusting the dashboard.
of US brand and agency marketers now run incrementality testing, up from niche status just two years ago
Adoption reflects the urgency. Roughly 36 percent of marketers plan to increase their incrementality investment over the next year. In retail media, where ad dollars are exploding past $60 billion, the ANA found that 71 percent of advertisers now rank incrementality as their single most important KPI. The reason is blunt: Meta and Google routinely over-attribute by 20 to 60 percent. A campaign showing 3x ROAS on-platform may deliver only 1.5x incrementally. If you are reallocating budget based on that inflated number, you are quietly overspending on channels that were never the real driver.
This is the same structural shift driving the comeback of marketing mix modeling and the rise of privacy-safe measurement inside data clean rooms. Incrementality testing is the experimental backbone that ties it all together.
Incrementality vs. MTA vs. MMM
Incrementality testing, multi-touch attribution (MTA), and marketing mix modeling (MMM) are the three pillars of modern measurement. They are not competitors so much as different lenses, each with a job to do. Confusing them is one of the most expensive mistakes in marketing analytics.
| Approach | What It Measures | Best For | Key Limitation |
|---|---|---|---|
| Incrementality Testing | Causal lift from a specific campaign or channel | Validating whether spend truly drives results | Point-in-time, requires test design and holdouts |
| Multi-Touch Attribution | How credit is distributed across touchpoints | Day-to-day optimization and channel tuning | Depends on user-level tracking, now degraded |
| Marketing Mix Modeling | Top-down impact of all channels over time | Strategic budget allocation, offline + online | Slower, needs years of data, less granular |
Here is the simplest way to hold the distinction. MTA tells you which touchpoints got credit. MMM tells you how much each channel contributes at a strategic level. Incrementality tells you whether any of it is actually true. MMM adoption alone has tripled in three years, climbing from 9 percent to 26 percent, precisely because teams need a signal-loss-resistant complement to attribution. Pair that with experiments and you get a measurement system you can defend in a board meeting. Our deeper breakdown of proving AI marketing ROI walks through how these layers reinforce one another.
The 4 Core Incrementality Testing Methods
There is no single way to run an incrementality test. The right method depends on the channel, your data access, and how cleanly you can split audiences. These four cover the vast majority of real-world programs.
1. Geo Holdout Testing (Geo Experiments)
Geo testing splits audiences by geography: cities, states, or postal codes. You run the campaign in treatment regions and hold out spend in control regions, then compare results. Because geography is a clean, privacy-safe way to isolate causal impact, geo tests shine for channels with no reliable user-level tracking, such as connected TV, podcasts, TikTok, and offline media. A landmark 2025 study analyzed 225 geo-based incrementality tests run between August 2024 and December 2025 to build public iROAS benchmarks, a sign of how mainstream the method has become.
2. Audience Holdout Testing
The classic randomized controlled trial. You randomly withhold ads from a slice of your target audience, then compare conversion rates between the exposed group and the holdout. This is the gold standard for owned channels like email, push, and CRM-driven retargeting, where you control exactly who sees what. It connects naturally to AI-powered A/B testing workflows, though incrementality holdouts measure something broader than a creative variant.
3. Ghost Ads and PSA Testing
Ghost ads, also called PSA (public service announcement) tests, are a clever fix for a subtle problem. Instead of showing the control group nothing, you show them a neutral placeholder ad or track the users who would have seen your ad through ghost bidding. Both groups experience the presence of advertising, which controls for the mere fact that an ad was served. Retail media platforms increasingly use a randomized controlled trial framework powered by ghost bidding to quantify causal lift during live campaigns without disrupting the broader media strategy.
4. Time-Based and Matched-Market Testing
When you cannot split by audience or geo, you can split by time, turning a channel on and off in alternating windows, or use matched markets, pairing statistically similar regions where one runs the campaign and one does not. These methods are less precise than randomized holdouts but invaluable for full-funnel brand channels where a clean control group is impossible.
Rule of thumb: Use audience holdouts for owned channels, geo tests for hard-to-track media like CTV and offline, and ghost ads for walled-garden platforms where you cannot control delivery directly.
How to Calculate Incremental Lift and iROAS
The math behind incrementality is refreshingly simple once your test is set up correctly. Incremental lift is the difference in conversion rate between your exposed group and your control group:
Incremental Lift % = (Exposed Rate − Control Rate) ÷ Control Rate × 100
iROAS = Incremental Revenue ÷ Ad Spend
Say your exposed group of 100,000 users converts at 5 percent (5,000 conversions) and your control group converts at 4 percent. Without ads, you would have expected 4,000 conversions anyway. Your incremental conversions are 1,000, and your incremental lift is 25 percent. If those 1,000 conversions generated $80,000 in revenue against $40,000 in spend, your incremental ROAS is 2.0x, even if the platform proudly reported 4.0x.
That gap is the whole point. Measured iROAS is typically 30 to 60 percent below platform-reported ROAS. Knowing the real number is what lets you reallocate budget with confidence instead of guesswork, the same discipline we cover in our predictive marketing analytics playbook.

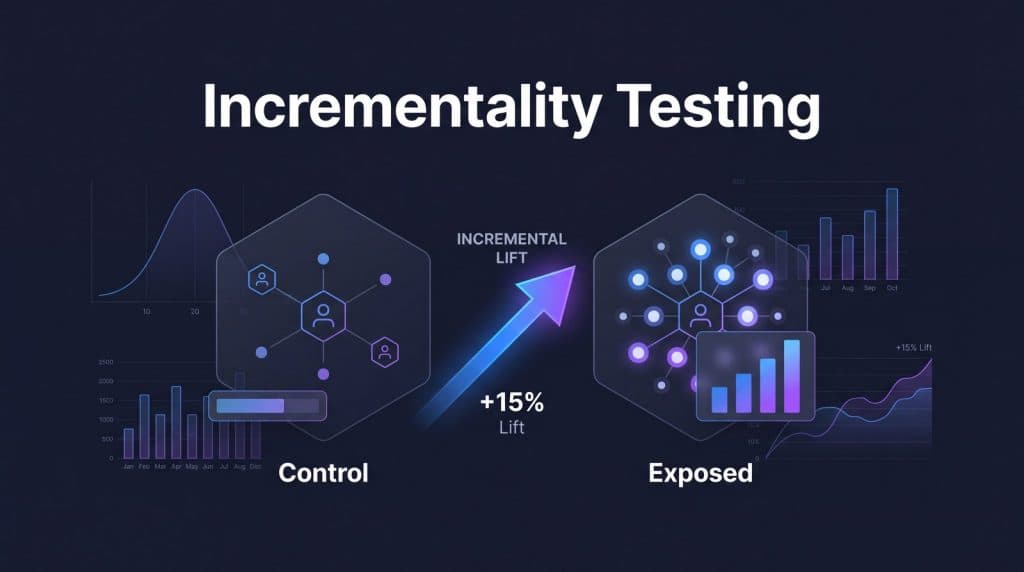
The incrementality testing framework: control vs. exposed groups, the four core methods, and how incremental lift becomes true iROAS.
How to Run an Incrementality Test: 7 Steps
A good incrementality test is part statistics, part discipline. Skip the setup and you will get a number that looks authoritative and means nothing. Here is the workflow that consistently produces trustworthy results.
Step 1: Pick one clear hypothesis
Test a single, specific question: does paused branded search lose us revenue? Does this retargeting audience drive incremental purchases? Vague tests produce vague answers.
Step 2: Choose your method and control
Match the method to the channel using the rules above. The quality of your control group determines the quality of your entire test, so make sure treatment and control are genuinely comparable.
Step 3: Size the test for significance
Calculate the sample size and test duration you need to detect a meaningful lift with statistical confidence. Underpowered tests are the leading cause of false negatives.
Step 4: Lock the test window
Run the test long enough to capture a full purchase cycle, but resist the urge to peek and stop early. Most digital tests run two to four weeks; longer sales cycles need more.
Step 5: Hold the line
Do not change creative, budget, or targeting mid-test. Any disruption contaminates the result. This is where automated guardrails earn their keep.
Step 6: Calculate lift and confidence
Compute incremental conversions, lift percentage, and iROAS, then check statistical significance. A 25 percent lift with wide confidence intervals is not a green light.
Step 7: Act and feed the loop
Reallocate budget based on incremental performance, then feed the learning back into your forecasting and marketing analytics so every future plan starts smarter than the last.
2026 Benchmarks and What Good Looks Like
Benchmarks are context, not targets, but they help you sanity-check results. The biggest takeaway from recent geo-test studies is that incremental performance varies wildly by channel and by how saturated your spend already is. A beauty brand running campaigns across Amazon, Ulta, and Sephora used geo-based holdout testing and found Amazon delivering a strong 2.8x iROAS while other placements lagged, proof that channel-level truth rarely matches the blended dashboard number.
A few patterns hold consistently in 2026. Lower-funnel, high-intent channels like branded search and retargeting often show inflated platform ROAS but modest incremental lift, because many of those buyers were already converting. Upper-funnel channels like CTV and social frequently show the opposite: weak attributed numbers but meaningful incremental impact that only experiments can surface. With retail media spend projected to reach $60.81 billion in 2025, adding more new ad dollars than Meta and Alphabet combined, the pressure to separate real lift from claimed lift is only intensifying. Teams running retail media networks and AI-driven PPC campaigns feel this most acutely.
5 Common Mistakes to Avoid
Most failed incrementality programs fail for predictable reasons. Watch for these.
- Contaminated control groups. If your holdout still sees the brand through other channels, your lift will read artificially low. Isolation is everything.
- Stopping early. Peeking at results and ending the test the moment it looks good inflates false positives. Predefine the window and honor it.
- Testing too small. Underpowered tests cannot detect real lift, so you conclude a winning channel does nothing. Size for significance first.
- Treating one test as forever truth. Incrementality is a snapshot. Saturation, seasonality, and creative fatigue shift it. Run tests on a cadence, not once.
- Ignoring triangulation. A single experiment in isolation is fragile. The strongest programs cross-check incrementality against MMM and attribution.
The bottom line: The cost of not measuring incrementality increasingly exceeds the cost of testing. As platform attribution degrades, experiments are no longer a nice-to-have. They are how you keep budget decisions honest.
Where MarqOps Fits: Triangulated Measurement
The most advanced and future-ready approach to measurement is triangulation: combining incrementality testing, marketing mix modeling, and always-on attribution into one unified view. No single method is complete on its own. Attribution is fast but biased, MMM is strategic but slow, and incrementality is rigorous but point-in-time. Used together, they cancel out each other’s blind spots and deliver the most complete, unbiased read on what your marketing actually drives.
The catch is that most teams run these three methods in three different tools, with three different data pipelines, and spend more time reconciling numbers than acting on them. That fragmentation is exactly what MarqOps was built to fix. Instead of stitching together seven-plus disconnected platforms, MarqOps unifies analytics, attribution, creative, and paid media in a single brand-intelligent system, so your incrementality results, attribution data, and modeled forecasts live side by side in one unified dashboard.
Because the platform is grounded in Brand Intelligence DNA, the measurement layer connects directly to execution. When a test proves a channel is incremental, the same system helps you scale brand-perfect creative against it up to 6x faster, no tab-switching, no exporting CSVs between tools. Measurement stops being a quarterly autopsy and becomes a live feedback loop that makes every campaign smarter. The same unification logic powers our approach to first-party data and creative analytics.
If you want to see how unified measurement and execution work together before you commit, take the quick tour.
Frequently Asked Questions
What is incrementality testing in simple terms?
Incrementality testing measures the conversions your marketing actually caused by comparing a group exposed to your ads against an equivalent control group that was held back. The difference between them is the true impact of your spend, stripping out sales that would have happened anyway.
What is the difference between incrementality testing and A/B testing?
A/B testing compares two versions of something, like two creatives or landing pages, to see which performs better. Incrementality testing compares advertising against no advertising to measure whether the campaign drove any additional outcome at all. A/B testing optimizes within a channel; incrementality validates whether the channel is worth running.
How accurate is platform-reported ROAS compared to incremental ROAS?
Platforms like Meta and Google routinely over-attribute by 20 to 60 percent. Measured incremental ROAS is typically 30 to 60 percent below the platform-reported number, which means a campaign showing 3x in the dashboard may only deliver around 1.5x in true incremental value.
Do I need incrementality testing if I already use attribution?
Yes. Attribution distributes credit but cannot prove causation, and with 73 percent of marketers distrusting their attribution data, that gap matters. Incrementality validates whether attributed conversions were genuinely driven by your ads. The strongest 2026 programs triangulate incrementality, attribution, and marketing mix modeling together.
Which incrementality testing method should small teams start with?
Start with an audience holdout on an owned channel like email or retargeting, where you fully control who sees the ad and the setup is simplest. As you grow, layer in geo holdout tests for harder-to-track channels like connected TV, social, and offline media.
MarqOps unifies analytics, attribution, creative, and paid media in one brand-intelligent platform, so marketing teams can measure what truly drives growth and act on it without switching tools.