Customer Acquisition Cost in 2026: How to Calculate, Benchmark, and Cut CAC
CAC rose 23% across industries in 2026. Here is the formula that holds up in a finance review, benchmarks by industry and channel, and the levers that actually lower it.
TL;DR
- Customer acquisition cost (CAC) is total sales and marketing spend divided by new customers acquired in the same period. The formula is simple. Getting the inputs right is where most teams fail.
- CAC rose roughly 23% across industries heading into 2026, driven by a 19% jump in average CPCs, 11% higher marketing labor costs, and signal loss that distorts reported CAC by 25% to 45%.
- Benchmarks vary wildly by motion: median B2B SaaS CAC is around $702 self-serve versus $11,400 sales-led. Ecommerce blended CAC lands between $60 and $120.
- Three numbers matter more than CAC alone: LTV:CAC (3:1 minimum, 4:1 investor bar), CAC payback (16-month median), and the gap between blended and paid CAC.
- The fastest CAC reductions in 2026 are not coming from better bidding. They come from cutting tool sprawl, fixing measurement, and moving content and creative production in-house with AI.
Table of Contents
- What Is Customer Acquisition Cost?
- The Customer Acquisition Cost Formula (and What Belongs In It)
- A Worked Example, Step by Step
- CAC Benchmarks 2026: By Industry, Channel, and Motion
- Why CAC Is Rising Faster Than Budgets
- The Three Metrics That Make CAC Useful
- Seven Ways Teams Miscalculate CAC
- How to Actually Reduce CAC in 2026
- A 90-Day CAC Reduction Roadmap
- Frequently Asked Questions
What Is Customer Acquisition Cost?
Customer acquisition cost is the total amount you spend to win one new paying customer. It bundles every dollar of sales and marketing effort, from ad spend and agency retainers to salaries and software licenses, and divides it by the number of customers those dollars produced.
That definition sounds obvious. In practice, CAC is the single most argued-about number in a marketing meeting, because finance calculates it one way, the growth team calculates it another way, and the ad platforms report a third number entirely. When a CFO asks “what does a customer cost us,” the honest answer at most companies is a shrug and a range.
The stakes are higher now than they were two years ago. Acquisition costs climbed roughly 23% across industries heading into 2026, and average cost per click rose about 19% as more advertisers chased a shrinking pool of clickable queries. Teams that cannot measure CAC accurately are effectively flying a plane with a broken altimeter, and they usually discover the problem at the worst possible moment: during a board meeting or a budget cut.
CAC is a diagnostic, not a scorecard. A rising CAC is not automatically bad, and a falling CAC is not automatically good. What matters is whether the customers you buy are worth more than what you paid, and how quickly you get that money back. We cover both in the companion metrics section below.
The Customer Acquisition Cost Formula (and What Belongs In It)
The formula itself is one line:
CAC = Total Sales & Marketing Spend ÷ New Customers Acquired
Both measured over the same time period
The disagreement is never about the division. It is about what goes above the line. Here is what a defensible numerator includes.
What belongs in the numerator
| Cost category | Include? | Why |
|---|---|---|
| Paid media spend | Yes | The most direct acquisition cost you control |
| Marketing and sales salaries | Yes | Often the largest line item, and rose about 11% last year |
| Agency and contractor fees | Yes | Substitute labor performing acquisition work |
| Martech licenses | Yes | Tool sprawl is a real and rising acquisition tax |
| Creative and content production | Yes | Assets exist to acquire, so they count |
| Sales commissions on new business | Yes | Variable cost of closing the customer |
| Customer success and onboarding | No | That is retention cost, and it belongs in LTV |
| Expansion and upsell spend | No | Existing customers are not new customers |
| Brand campaigns with no acquisition intent | Split | Track separately, then allocate a defensible share |
Blended CAC versus paid CAC
These are two different questions and both deserve an answer.
Paid CAC uses only paid media spend divided by paid-attributed customers. It tells you whether a specific channel is worth another dollar. Blended CAC uses all acquisition spend divided by all new customers, regardless of source. It tells you the true unit economics of the business.
The relationship between them is the most underrated diagnostic in marketing. If blended and paid CAC are nearly identical, your organic engine is weak and you are buying almost every customer you get. If blended CAC sits well below paid CAC, your brand, content, and referral loops are pulling real weight. Healthy companies work deliberately to widen that gap, which is one reason scaling organic search through automation has become a CFO-level conversation rather than an SEO-team one.
A Worked Example, Step by Step
Say a B2B software company closes its Q1 books with the following numbers.
- Paid media across search, paid social, and retargeting: $180,000
- Marketing team salaries and benefits (5 people, fully loaded): $210,000
- Sales development and account executive salaries attributable to new business: $240,000
- Martech licenses across nine tools: $54,000
- Agency retainer for creative and content: $45,000
- Commissions paid on new logos: $36,000
Total sales and marketing spend for the quarter: $765,000. New customers acquired in the same quarter: 92.
$8,315
Blended CAC ($765,000 ÷ 92 customers)
Now split it. If 38 of those customers came through paid channels, paid CAC is $180,000 divided by 38, or $4,737. The remaining 54 customers arrived through organic search, referrals, and word of mouth, carrying the fixed cost of the team but no incremental media spend.
That single split changes the strategy conversation. The blended number is the one the CFO cares about. The paid number is the one that tells you whether the next $50,000 in ad spend is a good idea. Both are correct. Reporting only one of them is how teams end up defending the wrong budget.
The trap here is timing. A customer who converts in March may have first touched your brand in October. If your sales cycle is longer than your measurement window, quarter-over-quarter CAC will swing for reasons that have nothing to do with performance. This is exactly the problem multi-touch attribution models and marketing mix modeling exist to solve, and why serious teams run both alongside cohort-based CAC.
CAC Benchmarks 2026: By Industry, Channel, and Motion
Benchmarks are useful for orientation and dangerous for goal setting. A $9,000 CAC is catastrophic for a $40-per-month product and excellent for a $200,000 enterprise contract. Read these as ranges that tell you whether you are in a normal neighborhood, not as targets.
By sales motion
The widest spread in the data is not between industries. It is between self-serve and sales-led. Median B2B SaaS CAC sits around $702 for self-serve products and $11,400 for sales-led motions, roughly a 16x gap. Self-serve products should generally target $200 to $600. Enterprise sales-led models can justify $1,500 to $3,000 or considerably more, as long as the LTV:CAC ratio holds above 3:1.
By industry
| Vertical | Typical CAC | What drives it |
|---|---|---|
| Fintech | ~$1,450 | Compliance friction and long due diligence |
| Insurance | ~$1,280 | Brutal keyword auctions and regulated messaging |
| General B2B SaaS | $400 to $900 | Highly dependent on motion and ACV |
| LegalTech | ~$299 | Narrow, high-intent audiences |
| Ecommerce and DTC | $60 to $120 blended | Rose 12% to 18% year over year |
By channel
Channel-level CAC is where budget decisions actually get made. The ordering has stayed remarkably stable even as absolute costs climbed.
- Email and SMS: $8 to $15. Still the cheapest acquisition channel by a wide margin, though it mostly converts demand that another channel created. AI-driven email programs have pushed this even lower for teams running behavior-triggered sends.
- Organic search: $70 to $120. High effort upfront, near-zero marginal cost afterward. This is the channel that widens the blended-versus-paid gap.
- Paid search: $50 to $130 for ecommerce, far higher in B2B. Median Google CPA landed near $24 for consumer categories while CPCs rose about 13%.
- Paid social: $150 to $300. Median Meta cost per acquisition reached roughly $38 in consumer categories, with CPMs up about 20% year over year.
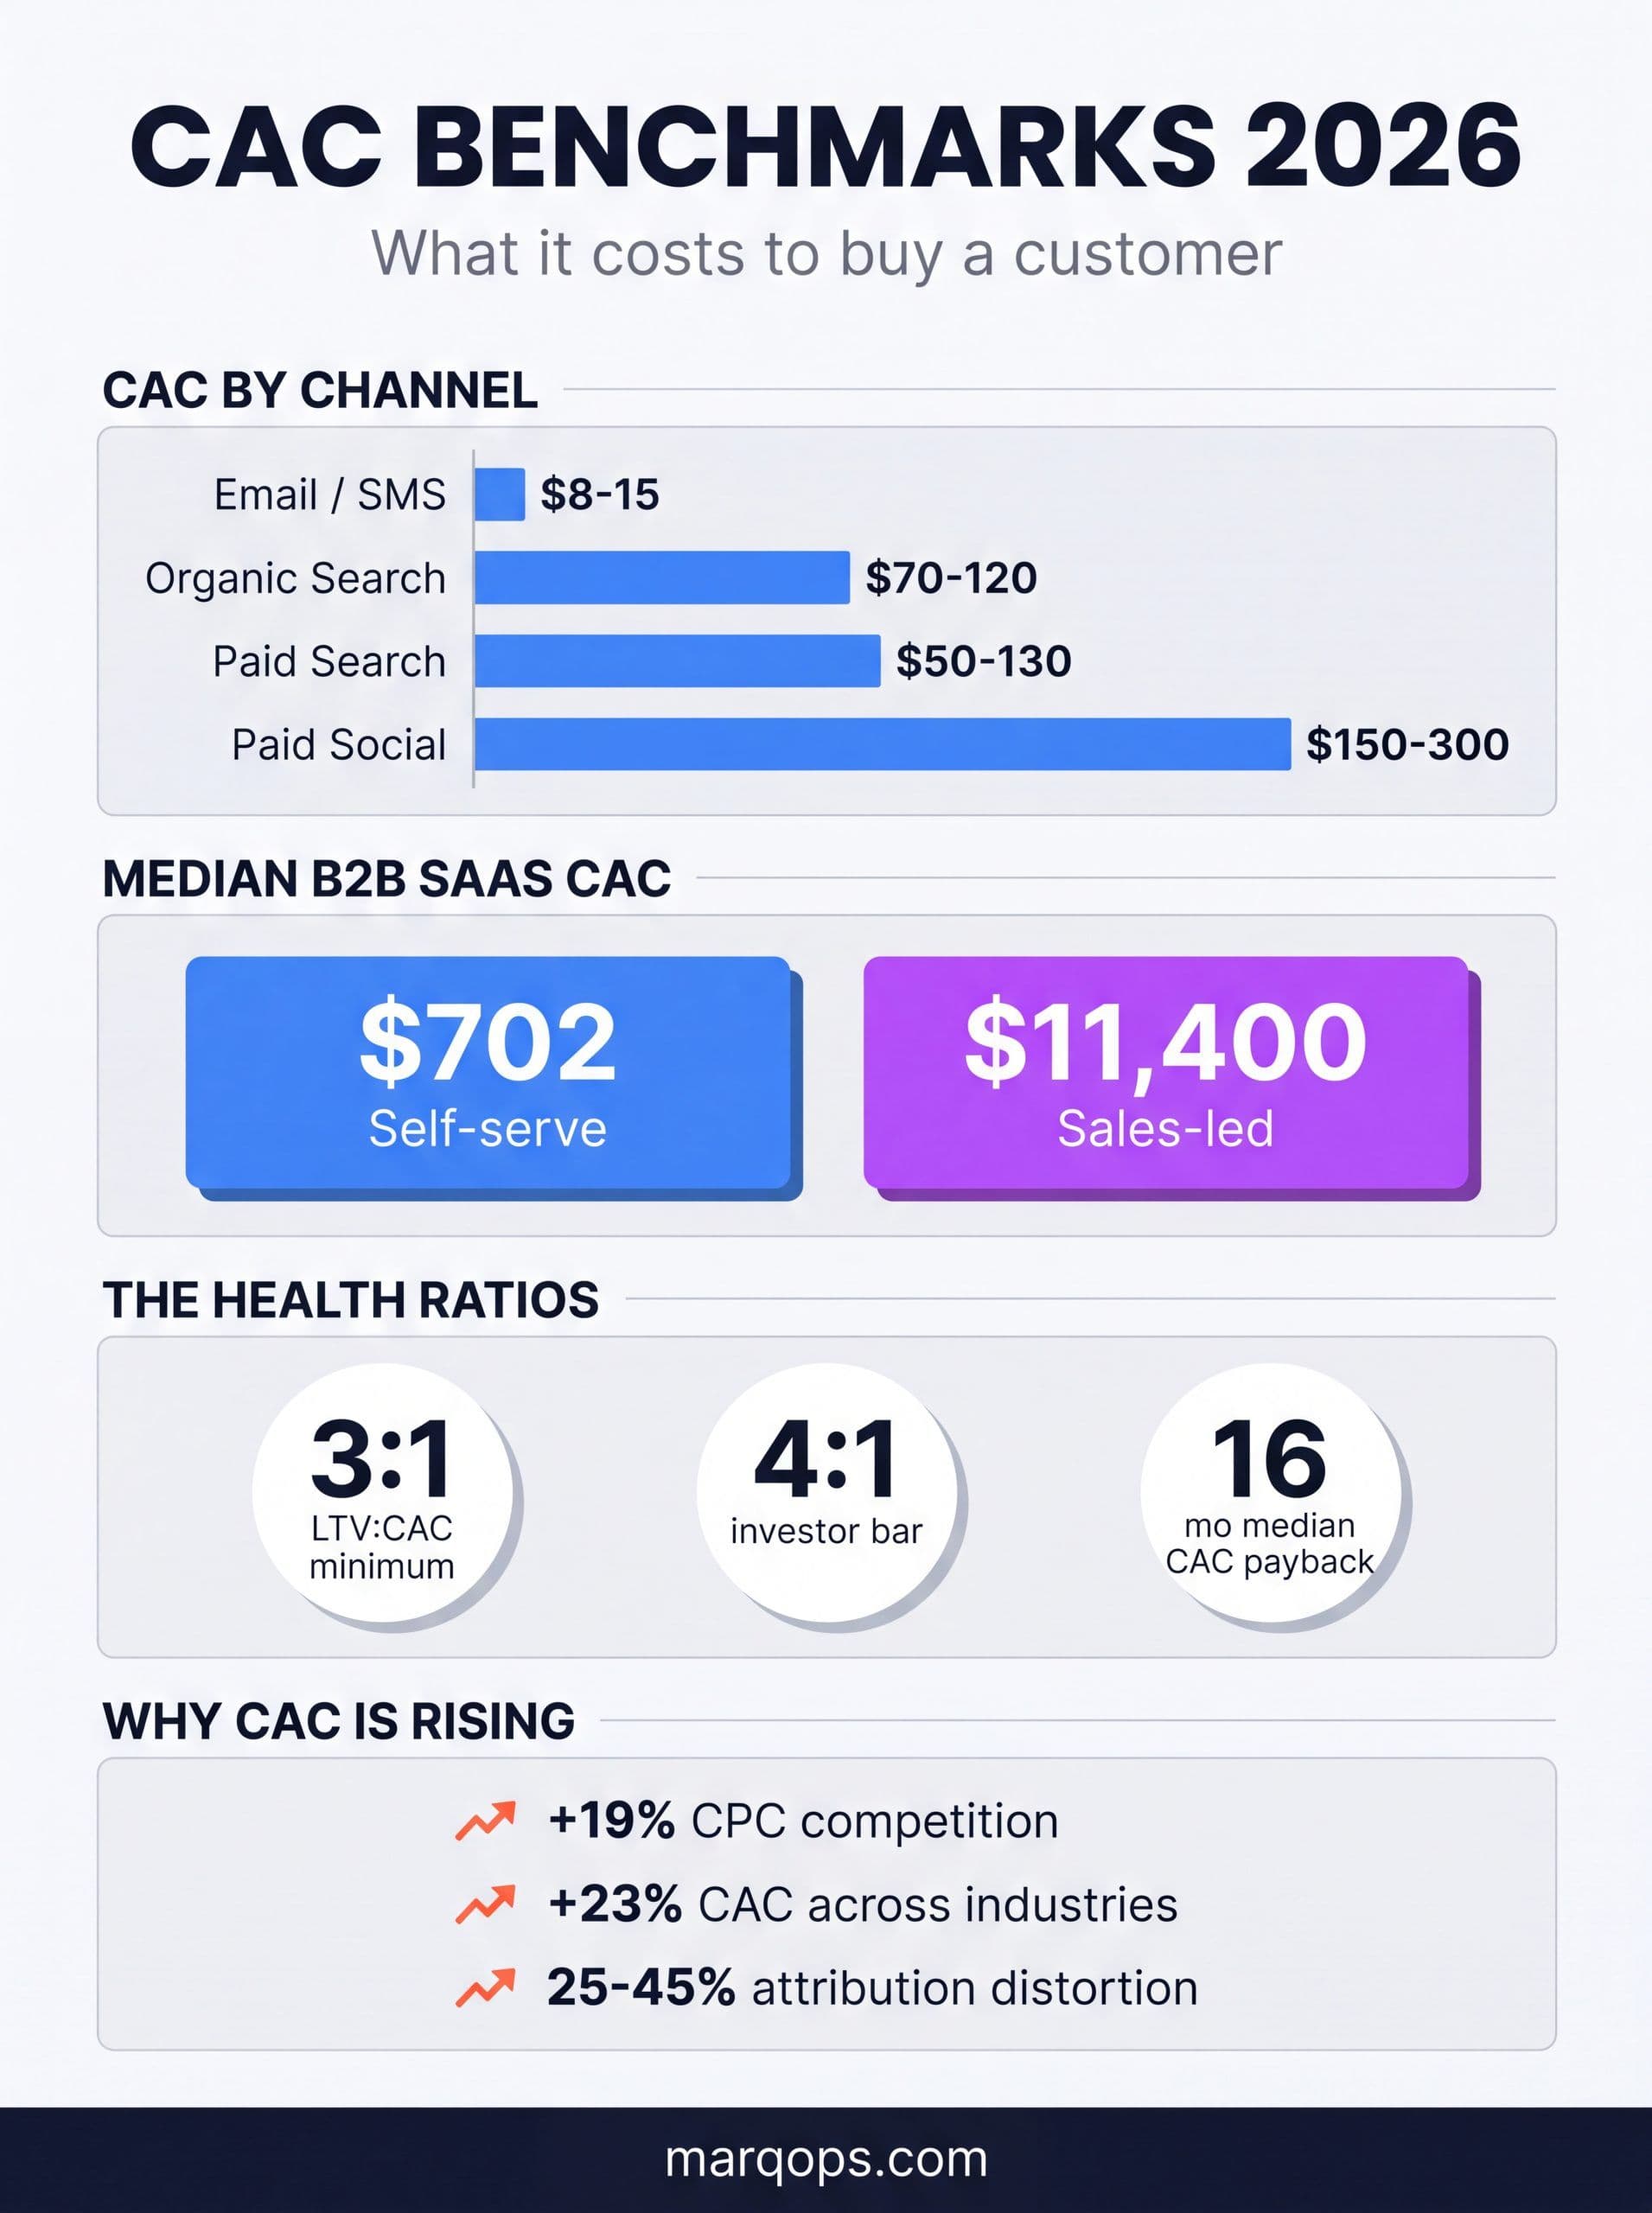
CAC benchmarks for 2026 across channels, sales motions, and the health ratios that matter most.
Why CAC Is Rising Faster Than Budgets
The increase is structural, not cyclical. Four forces are compounding.
1. Auction inflation with a shrinking click pool
Generative answers now absorb a large share of top-of-funnel queries that used to send traffic. Informational searches resolve on the results page, which leaves paid search competing for a narrower band of high-intent queries where bid pressure is fiercest. More advertisers, fewer available clicks, predictable outcome: average CPCs up roughly 19%. Understanding where Performance Max and Search each earn their keep matters more when every click costs a fifth more than it did last year.
2. Signal loss that distorts the number itself
Cookie deprecation and platform privacy changes have inflated reported CAC by an estimated 25% to 45% at many companies. Note the word reported. Some of the CAC increase teams are panicking about is a measurement artifact rather than a real cost increase. Companies that moved to server-side measurement and durable first-party data foundations are now paying less per acquired customer than they did in 2024, while teams still relying on pixel-only attribution are paying 25% to 45% more for the same outcomes.
3. Longer, more crowded buying cycles
B2B deals now require roughly 14% more touchpoints per closed deal than they did in 2023. Every extra touchpoint costs money in content, ad frequency, and sales time. This is where AI lead scoring and a sharply defined ideal customer profile pay for themselves, because the cheapest way to shorten a cycle is to stop starting the wrong ones.
4. The martech tax nobody puts in the CAC numerator
Organizations spend roughly $1,040 per employee per year across an average of 125 SaaS platforms, and most CMOs underestimate their true martech cost by 40% to 60% because the license fee is only about a third of the real number. The rest is integration work, implementation consultants, and the internal time spent stitching outputs between tools. Meanwhile 62% of marketers report using more tools than they did two years ago, even as vendor categories consolidate.
If you have never added your full martech bill to your CAC calculation, do it once. For most mid-market teams it moves CAC by 8% to 15%, and it reframes tool consolidation from an IT chore into a growth lever. Organizations that replaced fragmented tool collections with orchestrated AI systems report 30% to 70% reductions in technology costs.
The Three Metrics That Make CAC Useful
CAC in isolation tells you almost nothing. Paired with these three, it tells you nearly everything.
LTV:CAC ratio
Lifetime value divided by acquisition cost. The classic benchmark is 3:1, and that remains the minimum viable threshold. The bar has moved though. Investors now expect 4:1 or better for Series A and B, and they want to see it at the cohort level rather than blended across all customers.
2026 ranges by model: B2B SaaS around 3.2:1, vertical SaaS 3.5:1 to 4.2:1, DTC ecommerce 1.5:1 to 3:1, DTC subscription around 4.1:1. By channel in B2B SaaS, Google Ads typically returns 3:1 to 5:1, LinkedIn Ads 2.5:1 to 4:1, and organic search 5:1 to 8:1. If your ratio is above 5:1 across the board, you are probably underinvesting rather than winning. Accurate predictive lifetime value modeling is what keeps the numerator honest.
CAC payback period
How many months of gross profit it takes to recover what you spent acquiring the customer. This is the cash flow question, and for most companies it is more actionable than LTV:CAC because it does not require guessing five years into the future.
Median B2B SaaS CAC payback improved from 18 months in 2024 to 16 months in 2025, one of the largest single-year gains in four years of benchmark data. Top-quartile companies recover CAC in under 6 months. The bottom quartile takes 24 months or more.
Segment ranges are worth knowing: SMB under $15K ACV typically pays back in 8 to 12 months, mid-market $15K to $100K in 14 to 18 months, and enterprise above $100K in 18 to 24 months. Under 12 months is the practical bar for a company that can self-fund its own growth.
Marketing efficiency ratio and incrementality
Total revenue divided by total marketing spend gives you a blunt but honest efficiency read that no attribution model can inflate. Pair it with real incrementality testing to find out which spend is actually creating customers versus taking credit for customers you were going to get anyway. Most teams discover that 15% to 30% of their “attributed” conversions were not incremental at all, which means their real CAC on incremental customers is meaningfully higher than the dashboard says.
Seven Ways Teams Miscalculate CAC
- Counting ad spend only. Excluding salaries, tools, and agency fees can understate CAC by 50% or more. Your CFO will find this eventually.
- Mismatched time windows. Dividing this month’s spend by this month’s customers when your sales cycle is 90 days produces noise, not insight. Use cohorts.
- Including renewals and expansion in the customer count. Expansion revenue is a retention win. Putting it in the CAC denominator makes acquisition look cheaper than it is.
- Trusting platform-reported conversions. Every ad platform claims the same conversion. Summing platform-reported customers routinely exceeds actual new customers by 30% or more.
- Reporting a single company-wide number. A blended CAC across self-serve and enterprise hides the two very different businesses inside your business.
- Ignoring the martech line. See above. It is usually the second-largest hidden cost after unallocated headcount.
- Optimizing CAC without watching quality. The easiest way to cut CAC is to acquire worse customers. They churn, and you pay twice. Watch churn signals alongside acquisition cost or you are just moving the problem downstream.
How to Actually Reduce CAC in 2026
Bid optimization is table stakes and the platforms already do most of it. The meaningful reductions now come from four places.
Fix measurement before you touch budget
If 25% to 45% of your CAC increase is measurement distortion, the highest-return project is not a campaign change. It is server-side conversion tracking, offline conversion imports, and a single source of truth for what a customer actually costs. Teams that did this in 2025 are now paying less per customer than they did in 2024. Everything downstream, including Smart Bidding performance, depends on feeding the algorithm accurate conversion signals.
Widen the gap between blended and paid CAC
Every customer that arrives without incremental media spend pulls blended CAC down permanently. Organic search at $70 to $120 versus paid social at $150 to $300 is not a close contest. The catch has always been production capacity, and that is precisely what changed: teams running AI-assisted content operations are publishing at a volume that was economically impossible when every article required a freelancer and three rounds of edits.
MarqOps was built around this idea. Its Brand Intelligence DNA learns your voice, positioning, and visual system once, then produces on-brand content and creative from the start rather than after four revision cycles, which is where the 6x output gain comes from. When production cost per asset falls, organic becomes a volume game you can actually win.
Cut the tool tax
This is the most immediate lever and the one most teams skip. If martech is 8% to 15% of your CAC and organizations consolidating onto unified platforms report 30% to 70% technology cost reductions, the arithmetic is straightforward. Replacing seven disconnected point tools with one platform that handles creative production, SEO content, paid ads, and analytics removes both the license cost and the integration labor. Start with a full martech stack audit, then look at what a unified AI marketing platform replaces outright.
Improve conversion instead of buying more traffic
A 20% lift in conversion rate cuts CAC by roughly 17% with zero additional spend. It is the only lever that gets cheaper as CPCs get more expensive. Systematic testing across landing pages, offers, and onboarding flows compounds in a way that bid tuning never does. Pair it with the right CRO tooling so tests actually reach significance.
A 90-Day CAC Reduction Roadmap
Days 1 to 30: Establish the real number
- Agree with finance on exactly what goes in the numerator. Write it down. Stop relitigating it monthly.
- Calculate blended CAC, paid CAC, and CAC by segment for the last four quarters.
- Add your full martech bill, including integration and implementation labor, not just licenses.
- Build one unified dashboard where CAC, LTV:CAC, and payback are visible without exporting anything.
Days 31 to 60: Repair measurement and cut waste
- Implement server-side conversion tracking and offline conversion imports.
- Run one holdout test per major channel to separate incremental customers from attributed ones.
- Kill or consolidate every tool that fewer than three people use weekly.
- Pause the bottom-decile campaigns by CAC and reallocate rather than adding budget.
Days 61 to 90: Shift the mix
- Redirect 15% to 25% of paid budget into organic content and creative production capacity.
- Ship a structured testing program on your three highest-traffic conversion paths.
- Set segment-level CAC and payback targets, not one company-wide number.
- Review monthly against pipeline and revenue outcomes rather than lead volume.
Ninety days will not fix a broken business model. It will reliably surface whether your CAC problem is a spending problem, a measurement problem, or a conversion problem, and those three require completely different responses. Most teams find it is measurement first, tooling second, and media third, which is almost exactly the opposite of where they were spending their attention.
Frequently Asked Questions
What is customer acquisition cost in simple terms?
Customer acquisition cost is the total amount a company spends on sales and marketing divided by the number of new customers it acquired in the same period. If you spent $100,000 last quarter and gained 200 customers, your CAC is $500. It answers one question: what does it cost to buy a customer?
How do you calculate customer acquisition cost?
Add all sales and marketing costs for a period, including paid media, salaries, agency fees, martech licenses, creative production, and new-business commissions. Divide that total by the number of new customers acquired in the same period. Exclude customer success, onboarding, and expansion spend, since those are retention costs that belong in lifetime value instead.
What is a good customer acquisition cost?
There is no universal number, only a ratio. A good CAC produces an LTV:CAC ratio of at least 3:1, with 4:1 or better expected by investors, and a payback period under 12 to 18 months. Median B2B SaaS CAC is around $702 for self-serve and $11,400 for sales-led motions, while ecommerce blended CAC typically lands between $60 and $120.
What is the difference between blended CAC and paid CAC?
Paid CAC divides only paid media spend by paid-attributed customers, which tells you whether a specific channel deserves more budget. Blended CAC divides all acquisition spend by all new customers regardless of source, which reflects true unit economics. If the two numbers are close, your organic engine is weak. A wide gap means your brand and content are producing customers without incremental media cost.
Why is customer acquisition cost increasing in 2026?
Four factors are compounding: average cost per click rose about 19% as more advertisers compete for fewer clickable queries, marketing labor costs rose roughly 11%, B2B deals now require about 14% more touchpoints than in 2023, and privacy-driven signal loss inflates reported CAC by 25% to 45%. Some of the increase is real cost, and some is measurement distortion, which is why fixing tracking usually beats cutting budget.
How can AI reduce customer acquisition cost?
AI lowers CAC in three practical ways: it cuts content and creative production cost so organic channels become economically viable at volume, it consolidates fragmented tools that quietly inflate the CAC numerator, and it improves targeting and conversion so fewer impressions are wasted. Organizations replacing point tools with orchestrated AI systems report 30% to 70% reductions in technology costs alongside better marketing outcomes.
Where This Leaves You
CAC is climbing for structural reasons that are not going to reverse. Auctions will stay crowded, signal will stay degraded, and buying cycles will stay long. What is genuinely within your control is how accurately you measure the number, how much of it is tool sprawl you could delete tomorrow, and how much of your customer flow arrives without paying for the click.
That last one is the compounding lever. Teams that build durable organic pull and produce content and creative at low marginal cost do not just lower CAC once. They lower it every quarter, permanently, while their competitors bid against each other for the same shrinking pool of clicks.
MarqOps consolidates creative production, SEO content, paid ads management, and analytics into a single brand-intelligent platform, replacing seven or more disconnected tools and the integration work that comes with them. That removes a real line item from your CAC numerator while making the organic engine that widens your blended-versus-paid gap actually affordable to run.
Keep following the signal