Share of Search in 2026: The Metric That Predicts Market Share
Share of search is a fast, near-free brand health metric that predicts market share months before revenue moves. Here is how to measure, calculate, and grow it across Google and AI search.

Most brand health metrics tell you what already happened. Share of search is one of the few that tells you what is about to happen. It is fast, close to free, and research shows it tracks market share with roughly 83% accuracy, often months before your revenue moves. This guide breaks down what share of search is, how to measure it in Google Trends, how it compares to share of voice, and how the metric is evolving now that a growing share of buyer research happens inside AI answers.
TL;DR
- Share of search is the percentage of category search demand that goes to your brand versus competitors. It is a proxy for brand demand.
- Les Binet’s research found an 83% correlation between share of search and market share, with share of search often leading revenue by 6 to 24 months depending on category.
- You can measure it for free in Google Trends by comparing your brand against 3 to 5 direct competitors and aggregating the index values monthly.
- Share of search reflects how people respond to your marketing. Share of voice reflects what you spend. The two are complementary, not interchangeable.
- In 2026, brand discovery is splitting across Google, AI Overviews, and chatbots like ChatGPT, so share of search is expanding into a broader idea of share of answer and AI visibility.
- MarqOps unifies brand search tracking, competitive intelligence, and content operations in one dashboard so you can grow share of search instead of just reporting it.
Table of Contents
- What Is Share of Search?
- Why Share of Search Predicts Market Share
- Share of Search vs Share of Voice
- How to Measure Share of Search in Google Trends
- How to Calculate Share of Search (Formula)
- Share of Search in the Age of AI Search
- How to Improve Your Share of Search
- Limitations and Common Mistakes
- How MarqOps Helps You Track and Grow Share of Search
- Frequently Asked Questions
What Is Share of Search?
Share of search is a brand health metric that measures the volume of organic searches for your brand as a proportion of all brand searches in your category. Put simply, out of every person searching for a brand like yours, what percentage is searching for you.
If your category has five meaningful players and 100,000 people search for those brands in a month, and 22,000 of those searches are for your brand, your share of search is 22%. The beauty of the metric is that it captures genuine, unprompted consumer interest. Nobody types your brand name into Google unless something, an ad, a recommendation, a past experience, a review, put you on their radar. Search is the moment intent becomes visible.
The concept was popularized by Les Binet, head of effectiveness at adam&eveDDB, who presented it at the IPA EffWorks Global 2020 conference as a “fast, cheap, and predictive” alternative to expensive brand tracking surveys. Instead of paying for quarterly panels, you can pull directional brand demand data from Google Trends in an afternoon.
The core idea: people search for brands before they buy them. So a rising share of search today is often a preview of rising market share tomorrow.
Why Share of Search Predicts Market Share
This is the part that turns a curiosity into a boardroom metric. Binet’s analysis across categories including automotive, energy, and mobile phones found a correlation of roughly 83% between share of search and share of market. More importantly, share of search tends to move first. It is a leading indicator, not a lagging one.
83%
correlation between share of search and market share (Les Binet)
The lead time varies by how considered the purchase is. For fast decisions, search and sales move close together. For big, planned purchases, the gap is wider and more useful:
- Cars: share of search led market share by roughly one year on average.
- Mobile phones: a lead time of up to six months.
- General pattern: brands with a rising share of search typically saw market share follow within 6 to 24 months.
That lead time is the strategic payoff. If your share of search starts climbing after a brand campaign, you have early evidence the campaign is working long before it shows up in revenue. If it starts sliding while sales still look healthy, you have an early warning that demand is eroding underneath you. Waiting for the sales report to tell you the same thing means reacting a year late.
It works because search sits at the intersection of memory and intent. Marketing builds mental availability, the likelihood your brand comes to mind in a buying situation. When a real need arises, that mental availability converts into a search. Aggregate enough of those searches and you get a live read on brand strength that no survey can match for speed or cost. For a deeper look at turning that demand into a measurable pipeline, see our guide to demand generation.
Share of Search vs Share of Voice
These two metrics get confused constantly, and the difference matters. The short version: share of voice measures what you put into the market. Share of search measures how people respond to it.
Share of voice traditionally measures your brand’s share of category advertising presence, weighted toward paid channels like TV, radio, and digital media. It is an input. Share of search measures actual search behavior across your audience. It is an output, a reflection of genuine consumer interest rather than spend.
| Dimension | Share of Voice | Share of Search |
|---|---|---|
| What it measures | Your share of advertising and messaging presence | Your share of category search demand |
| Input or output | Input (what you spend) | Output (how people react) |
| Cost to measure | Often requires paid ad or media tools | Free via Google Trends |
| Predictive of market share | Indirect | Directly, roughly 83% correlation |
| Best used for | Planning spend and competitive pressure | Measuring brand health and demand |
The smart move is to track both. Excess share of voice, spending more than your market share would predict, is what drives future growth. Share of search is how you confirm that spending is actually landing. Together they close the loop between investment and demand. If you are building a wider measurement stack, our guides to marketing mix modeling and multi-touch attribution show how these signals fit alongside share of search.
How to Measure Share of Search in Google Trends
You do not need a big budget to start. Google Trends gives you the raw material for free. Here is the practical workflow.
Step 1: Pick your competitive set
List 3 to 5 direct competitors that serve the same customer and product category as your brand. Keep it tight. Adding unrelated brands or overly broad terms will distort the picture. You want the brands a buyer would genuinely consider alongside yours.
Step 2: Enter brands as search terms
In Google Trends, type your brand name in the first box, then use “Add a search term” to add each competitor in the same view. Use the “search term” option rather than a specific “topic” when you want to control exactly what is counted, though topics can help disambiguate brands with generic names.
Step 3: Set location, time range, and search type
Choose your main sales market, or “Worldwide” if you sell globally. Set a time range long enough to see trend, such as the past 12 months or five years. Leave search type on Web Search as your baseline. Consistency here matters more than the exact settings, so lock in your parameters and reuse them every reporting cycle.
Step 4: Download and aggregate monthly
Export the CSV and aggregate the data by month. Weekly data fluctuates heavily, especially for smaller brands, so monthly averages give a cleaner signal. If you report quarterly, roll monthly values into quarter averages.
Important nuance: Google Trends returns a relative index from 0 to 100, not raw search counts. It shows how popular a term is compared to the highest point in your selected time and region. That is fine for share of search, because you care about proportions between brands over time, not absolute volume.
How to Calculate Share of Search (Formula)
Once you have the index values, the math is simple. For any period:
Share of Search =
Your brand’s search index
÷
Total search index of all brands in the set
× 100
A worked example. Say your monthly Google Trends indices are:
- Your brand: 40
- Competitor A: 30
- Competitor B: 20
- Competitor C: 10
Total = 100. Your share of search = 40 ÷ 100 × 100 = 40%. Track that percentage month over month. A single month can jump around after a campaign or launch, but a steady climb across several months is a real signal that brand interest is improving relative to competitors. A steady decline is the early warning you want to catch.
You can run the same calculation in two useful cuts. Organic share of search uses only unpaid Google Trends demand and is the cleanest read on brand health. Paid share of voice, drawn from your ad platforms, tells you how much of the auction you are winning. Comparing the two shows whether you are buying visibility or genuinely earning it.
Share of Search in the Age of AI Search
Here is where 2026 changes the conversation. For two decades, “search” effectively meant Google, and Google Trends was a near complete picture of brand demand. That is no longer true. A large and growing slice of buyer research now happens inside AI answers, and those queries never show up in classic search data.
The scale is hard to ignore. Google AI Overviews now appear on close to half of queries, and estimates put zero-click consumption, where the answer is delivered without a click to any website, at 83 to 93% of searches. ChatGPT crossed 1 billion monthly active users in May 2026. When a buyer asks a chatbot “what is the best platform for X,” your brand either appears in that answer or it does not, and no Google Trends line will tell you which.
1 in 6
how often the average brand appears in a relevant AI answer
This is why share of search is evolving into a broader family of visibility metrics. Marketers now talk about share of answer or share of model, which measure how much of the AI-generated answer experience your brand owns across chatbots, AI Overviews, and answer boxes. Share of search measures whether people are looking for you. Share of answer measures whether AI recommends you when they ask.
The practical takeaway: keep tracking share of search as your core brand demand signal, but add AI visibility tracking alongside it. A brand can have healthy search demand and near-zero presence in AI answers, which is a gap competitors will exploit. To go deeper on the AI side, read our guides to AI visibility, answer engine optimization, Google AI Overviews, and LLM SEO.
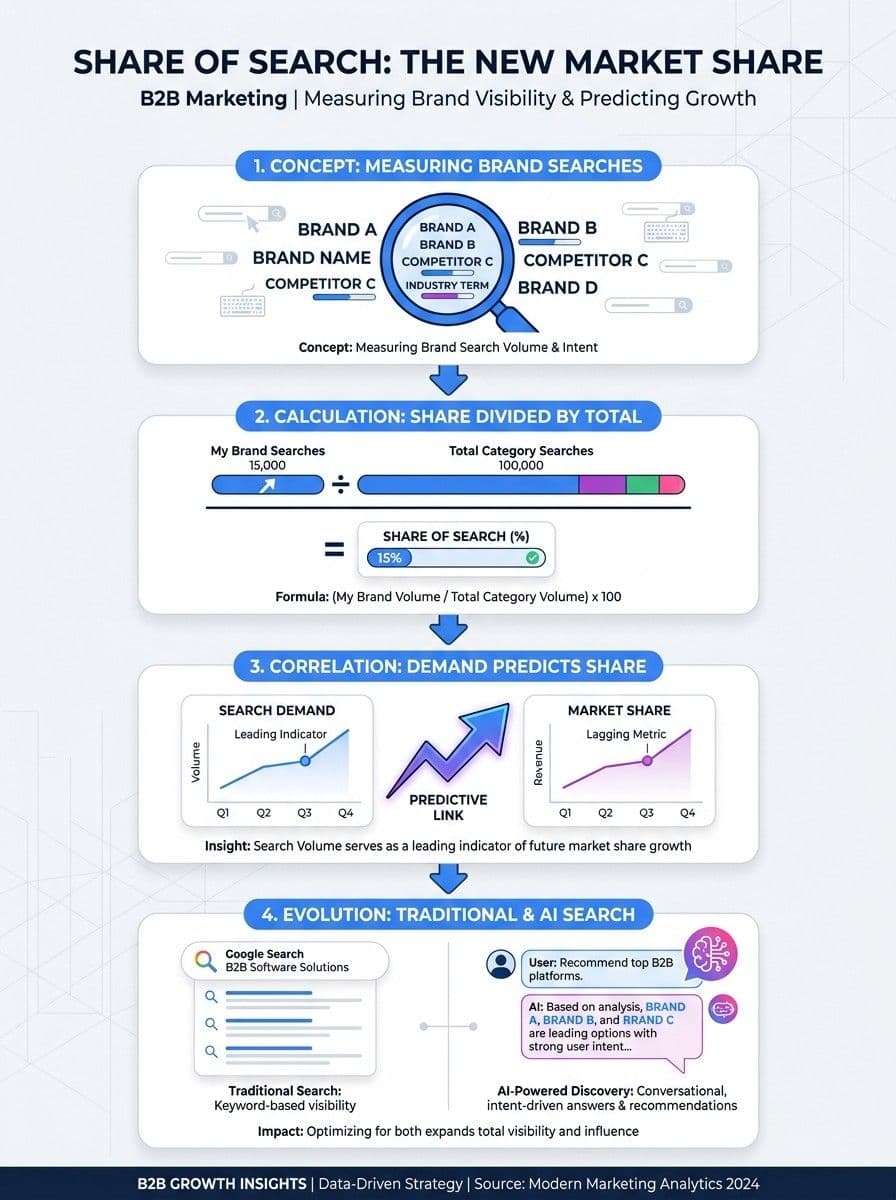
The share of search framework, from measurement in Google Trends to growth across traditional and AI search.
How to Improve Your Share of Search
Measuring the metric is step one. Moving it is the real work. Because share of search reflects brand demand, you grow it by growing how many people know, remember, and actively look for you.
1. Invest in brand building, not just performance
Performance marketing harvests existing demand. Brand marketing creates it. Share of search responds most to the campaigns that build mental availability: distinctive creative, consistent messaging, and reach across your category audience. If your share of search is flat, you are likely over-indexed on bottom-funnel activity.
2. Build category-level topical authority
When you own the conversation around a category, branded search follows. Publishing genuinely useful content that answers buyer questions builds the associations that trigger searches later. Our guide to topical authority covers how to structure this at scale.
3. Show up where the research happens
That now means Google, AI Overviews, and chatbots. Optimizing for both traditional and generative search keeps your brand in front of buyers at the moment they are forming a shortlist, which feeds branded search demand.
4. Monitor competitors and act on the gaps
Share of search is relative. You can grow your absolute demand and still lose share if a competitor grows faster. Continuous competitive intelligence and brand monitoring tell you where you are gaining and where you are being outspent or out-messaged.
Limitations and Common Mistakes
Share of search is powerful, but it is a directional metric, not gospel. Binet himself framed it as a fast and cheap predictor, not a perfect one. Keep these caveats in mind.
- Conversion is affected by other factors. Price, distribution, and availability all shape whether search demand becomes revenue. A rising share of search will not save a product that is priced out of the market.
- Brand names that are also generic words distort the data. If your brand is a common word, use Google Trends topics or add qualifiers so you are not counting unrelated searches.
- Relative index, not volume. Google Trends will not tell you if the whole category is shrinking. Pair share of search with absolute category volume to see the full picture.
- Weekly noise misleads. Always aggregate to monthly or quarterly. Reading week-to-week wiggles as trends is the most common mistake.
- It misses AI answers. As covered above, a growing share of discovery happens off-Google. Treat share of search as one input in a broader visibility view, not the whole story.
Used well, share of search is the closest thing marketing has to an early revenue radar. Used carelessly, it is a noisy chart. The difference is discipline: same competitive set, same settings, monthly aggregation, tracked over time.
How MarqOps Helps You Track and Grow Share of Search
The catch with share of search is that measuring it is easy, but acting on it means connecting brand demand data to the work that actually moves it: content, SEO, ads, and creative. In most teams those live in seven or more disconnected tools, which is exactly why the signal rarely turns into action.
MarqOps replaces that fragmented stack with one platform. Its unified dashboard brings brand search trends, competitive intelligence, and AI visibility into a single view, so you can watch share of search and share of answer side by side instead of stitching together spreadsheets. Its Brand Intelligence DNA keeps every piece of output, from blog content to ad creative, consistent with your brand, which is what builds the mental availability that drives branded search in the first place.
Because content production, SEO operations, and paid campaigns run inside the same system, teams ship roughly 6x faster and can respond to a dip in share of search with real work in days, not quarters. And with AI marketing analytics layered on top, you can connect movements in brand demand to the campaigns behind them. One platform replaces the tab-switching, and the metric finally connects to the levers that change it.
Frequently Asked Questions
What does share of search mean?
Share of search is the percentage of total brand searches in your category that go to your brand rather than competitors. It reflects unprompted consumer interest and is used as a proxy for brand demand and a predictor of market share.
How do you measure share of search?
Use Google Trends to compare your brand against 3 to 5 direct competitors, set a consistent location and time range, export the CSV, and aggregate the index values by month. Your share is your brand’s index divided by the total index of all brands, times 100.
Is share of search really predictive of market share?
Research by Les Binet found roughly an 83% correlation between share of search and market share, with search often leading sales by 6 to 24 months depending on category. It is a strong directional predictor, though not a perfect one, since price and availability also affect conversion.
What is the difference between share of search and share of voice?
Share of voice measures your share of advertising and messaging presence, an input you control through spend. Share of search measures actual search behavior, an output that reflects how people respond. Share of voice is what you put in, share of search is what comes back.
How does AI search change share of search?
A growing share of buyer research now happens inside AI answers like ChatGPT and Google AI Overviews, which do not show up in Google Trends. Marketers are adding share of answer or share of model metrics, which measure how often your brand appears in AI-generated responses, alongside traditional share of search.
Is share of search free to measure?
Yes. The core data comes from Google Trends, which is free. Paid tools can add automation, larger competitive sets, and AI visibility tracking, but you can calculate a solid share of search using only Google Trends and a spreadsheet.
Turn brand demand into action
Track share of search and share of answer in one place, then act on them with unified content, SEO, and ad operations. MarqOps replaces 7+ tools with a single brand-intelligent platform.
Keep following the signal
Related field notes
Marketing
Brand Asset Management in 2026: How to Run It Without Adding Another Tool
14 min readMarketing Operations
Marketing Project Management Software in 2026: How to Choose Without Adding Tool #122
11 min readMarketing Analytics