Marketing KPIs in 2026: The Metrics That Actually Predict Revenue
The complete 2026 guide to marketing KPIs: a five-tier framework, current benchmarks for CAC, LTV:CAC, email and paid search, the new AI visibility metrics, and how to build a dashboard your CFO trusts.

Marketing KPI dashboard showing revenue, pipeline and channel metrics
Every marketing team tracks numbers. Very few track the right ones. In 2026, 64% of CMOs say proving marketing’s value is their single biggest challenge, and only about 30% feel confident measuring marketing ROI at all. That is not a data problem. Most teams have more data than they can read. It is a KPI problem: the wrong metrics on the dashboard, updated too slowly, disconnected from revenue.
This guide covers the marketing KPIs that actually predict revenue in 2026, the benchmarks to measure yourself against, the new AI-era metrics that did not exist three years ago, and how to assemble all of it into a dashboard your CFO will trust.
TL;DR
- A marketing KPI is a metric tied to a business decision. If no one changes behavior when it moves, it is a metric, not a KPI.
- Use five tiers: revenue, pipeline, channel, brand and AI visibility, and operational efficiency. Most teams need 12 to 18 KPIs total, not 60.
- 2026 benchmarks worth knowing: median B2B SaaS LTV:CAC of 3.2:1, CAC payback around 8.6 months, email open rates near 20.7%, Google Ads search CTR around 6.6%, and average B2B site conversion of 2% to 3%.
- MQL volume is no longer a headline KPI. Fewer than 1% of leads ever close, and MQLs convert to SQLs roughly 13% of the time. Pipeline sourced, pipeline influenced, and CAC payback replaced it.
- New AI-era KPIs matter now: AI share of voice, citation share, prompt-level visibility, and branded search lift from AI answers.
- Enterprises run an average of 91 martech tools and utilize only about 49% of stack capability, which is why most KPI dashboards are stale before anyone reads them.
Table of Contents
- What Are Marketing KPIs?
- KPI vs Metric: The Difference That Saves Your Dashboard
- Why Marketing KPIs Broke in 2026
- The Five-Tier Marketing KPI Framework
- Tier 1: Revenue KPIs
- Tier 2: Pipeline and Demand KPIs
- Tier 3: Channel KPIs (With 2026 Benchmarks)
- Tier 4: Brand and AI Visibility KPIs
- Tier 5: Marketing Operations KPIs
- How to Choose Your KPIs: The Five-Question Test
- How to Build a Marketing KPI Dashboard That Gets Used
- Marketing KPI Examples by Team Type
- Seven Mistakes That Kill KPI Programs
- Frequently Asked Questions
What Are Marketing KPIs?
Marketing KPIs (key performance indicators) are the small set of quantifiable measures a marketing team uses to judge whether its work is moving the business toward a specific goal. The emphasis belongs on small set and specific goal. A KPI answers a question someone with budget authority is actually asking, such as “is our acquisition getting more or less efficient?” or “is the pipeline we source converting faster than last quarter?”
Three properties separate a real KPI from a number on a slide:
- It maps to an objective. Every KPI should trace back to a revenue, retention, or efficiency goal in one or two hops.
- It has a target and a threshold. “Track CAC” is not a KPI. “Keep blended CAC under $900 with payback inside 12 months” is.
- Someone owns it. An unowned KPI is a screensaver.
KPI vs Metric: The Difference That Saves Your Dashboard
Every KPI is a metric. Almost no metric is a KPI. Impressions, page views, follower count, email list size, and gated asset downloads are metrics. They are useful for diagnosing why a KPI moved, and useless as headline numbers because nobody changes a budget decision based on them.
The practical test: if this number doubled overnight, would anyone do anything differently? If the honest answer is no, it belongs in a channel report, not on the executive dashboard.
Keep the diagnostic metrics. Just demote them. A healthy setup has 12 to 18 KPIs at the top and a few hundred supporting metrics one click below.
Why Marketing KPIs Broke in 2026
Four shifts made the standard 2019-era marketing dashboard misleading.
1. Search stopped producing clicks
AI Overviews, AI Mode, and assistant-first search mean a growing share of demand never registers as a session. Traffic can fall while brand demand rises. Teams still reporting sessions as their primary SEO KPI are watching a metric that no longer tracks reality. This is the core problem behind zero-click search, and it forces a new measurement layer covered in the AI visibility section below.
2. MQLs stopped predicting revenue
Forrester research puts the share of leads that ever close below 1%, and MQL-to-SQL conversion sits around 13%. A record MQL quarter routinely produces a flat pipeline quarter. Most serious B2B teams have moved the MQL down to a channel diagnostic and elevated pipeline marketing metrics in its place.
3. Attribution got harder, not easier
Cookie deprecation, privacy regulation, dark social, and buying committees of eight to twelve people mean last-touch attribution now credits the wrong channel most of the time. Mature teams triangulate with three methods instead of trusting one: multi-touch attribution for directional channel credit, marketing mix modeling for budget-level allocation, and incrementality testing for causal proof.
4. The data lives in too many places
The 2026 martech landscape holds roughly 15,505 tools. The average enterprise runs 91 of them, two thirds of teams juggle 16 or more, and Gartner puts overall stack utilization at about 49%. When your KPIs live in eight systems, the weekly report becomes a copy-paste exercise and the numbers are three days stale by the time anyone sees them.
41%
of marketers can demonstrate ROI on their AI investments in 2026, down from 49% a year earlier
The Five-Tier Marketing KPI Framework
Rather than picking KPIs channel by channel, structure them in tiers. Each tier answers a different question, and each tier has a different audience and reporting cadence.
| Tier | Question it answers | Audience | Cadence |
|---|---|---|---|
| 1. Revenue | Is marketing profitable? | CEO, CFO, board | Monthly, quarterly |
| 2. Pipeline | Will revenue arrive next quarter? | CMO, CRO, sales leadership | Weekly |
| 3. Channel | Which channels are working? | Channel owners, agencies | Weekly |
| 4. Brand and AI visibility | Are we becoming the default answer? | CMO, brand, SEO | Monthly |
| 5. Operations | Is the team getting faster and cheaper? | Marketing ops | Monthly |
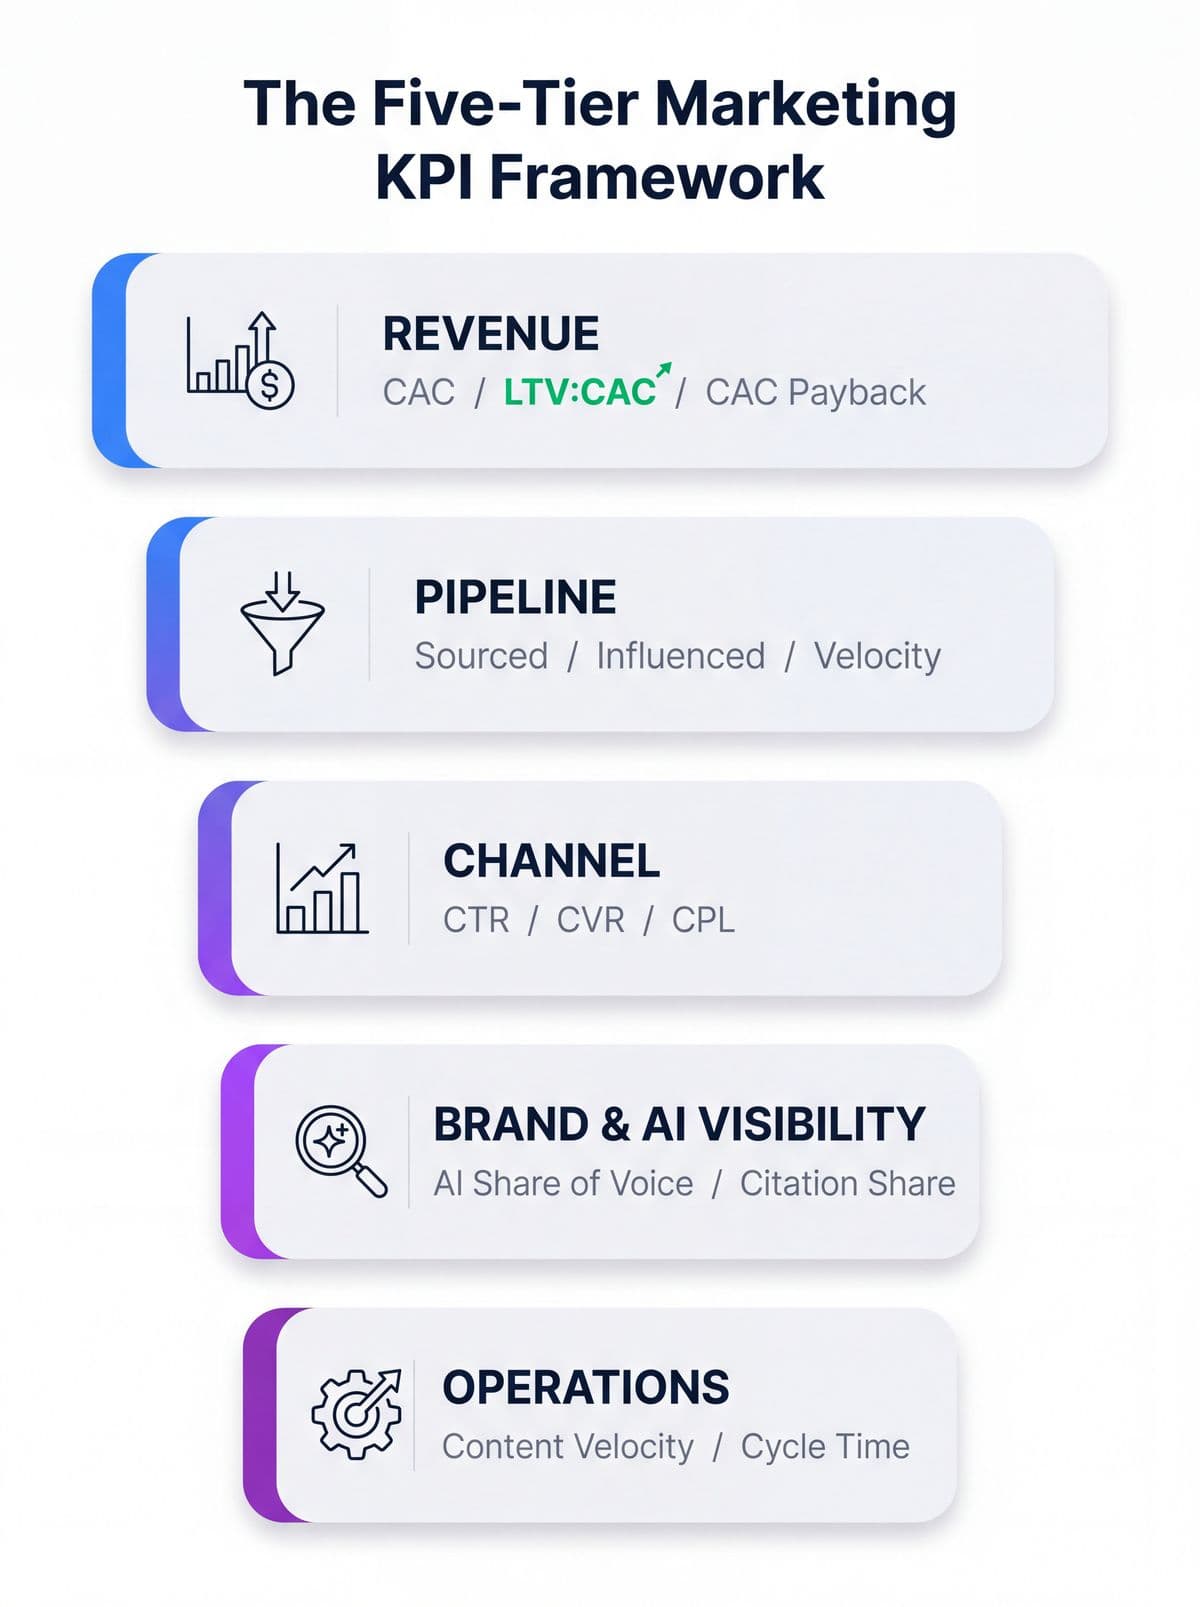
The five-tier marketing KPI framework: what to track at each level, and who reads it.
Tier 1: Revenue KPIs
These are the five numbers a CFO will ask about. Get them right before adding anything else.
Customer Acquisition Cost (CAC)
Total sales and marketing spend divided by new customers acquired in the same period. Track blended CAC and paid CAC separately, because blending organic into the number hides paid inefficiency. Median B2B SaaS CAC sits around $702, though the industry-wide average runs closer to $1,200. Organic search consistently delivers the lowest acquisition cost, roughly $480 to $942 per customer against about $802 for paid search. Our full breakdown of formulas, benchmarks, and reduction tactics lives in the customer acquisition cost guide.
LTV:CAC ratio
Lifetime value divided by acquisition cost. The classic target is 3:1. Median B2B SaaS performance in 2026 is about 3.2:1, and companies above $10M ARR often reach 3.8:1 to 5:1. A ratio above 5:1 usually means you are underinvesting in growth rather than winning. Getting the numerator right requires real modeling, not a spreadsheet average, which is why predictive customer lifetime value has become standard practice.
CAC payback period
Months required to recover acquisition cost through gross margin. Median is roughly 8.6 months, with elite performers near 80 days. This is the KPI CFOs care about most in a tight capital environment, because it directly determines how fast you can reinvest.
Marketing-sourced and marketing-influenced revenue
Sourced means marketing created the opportunity. Influenced means marketing touched it meaningfully before close. Report both, define both in writing with sales, and never let the definitions drift mid-year.
Return on marketing investment (ROMI) or MER
Revenue attributable to marketing divided by marketing spend. Ecommerce teams typically use marketing efficiency ratio (total revenue over total ad spend) because it sidesteps attribution disputes entirely. For a deeper treatment of proving and multiplying returns, see our guide to AI marketing ROI.
Tier 2: Pipeline and Demand KPIs
Revenue KPIs are lagging. Pipeline KPIs tell you what revenue will look like in one or two quarters, which makes them the most actionable tier for a B2B team.
- Pipeline sourced and pipeline influenced (dollar value). The replacement for MQL volume. Measure in currency, not counts.
- SQL volume and SQL acceptance rate. Leads sales validated as ICP-fit. Acceptance rate is your quality signal.
- Pipeline velocity. Number of opportunities times average deal value times win rate, divided by sales cycle length. It combines four inputs into one number that shows whether the engine is speeding up.
- Win rate by source. Frequently reveals that the channel with the cheapest leads has the worst close rate.
- In-market account coverage. The share of your target account list currently showing buying intent. Pairs directly with ideal customer profile scoring.
- Average deal size and sales cycle length. Both drift quietly and both change your CAC math.
Tier 3: Channel KPIs (With 2026 Benchmarks)
Channel KPIs belong to channel owners. They are diagnostic: they explain why tier 1 and tier 2 numbers moved. Here are the 2026 benchmarks to calibrate against.
| Channel | Primary KPI | 2026 benchmark |
|---|---|---|
| Open rate / CTR / CTOR | ~20.7% open, ~2.3% CTR, ~6.8% CTOR | |
| Paid search | CTR / CVR / CPC / CPL | ~6.6% CTR, 4.4% to 7% CVR, ~$5.42 CPC, ~$66.69 CPL |
| Website | Conversion rate | 2% to 3% for B2B |
| Organic search | Non-brand qualified sessions, CAC | $480 to $942 CAC, highest ROI channel |
| Retention | Annual churn | ~3.5% for B2B SaaS |
Two cautions on benchmarks. First, Apple Mail Privacy Protection inflates open rates, so treat open rate as a trend line rather than a truth. Second, industry variance is enormous. Google Ads conversion rates range from about 2.8% in ecommerce to nearly 15% in auto repair, so your own 90-day trailing average is a better target than any published figure. If your paid team is fighting for efficiency, our guide to smart bidding covers which signals actually move CPA.
Tier 4: Brand and AI Visibility KPIs
This tier did not exist in most dashboards two years ago. It exists now because a meaningful share of buyer research happens inside ChatGPT, Gemini, Perplexity, Claude, and Google AI Mode, where there is no rank position and often no click.
- AI share of voice. The percentage of AI answers for your category prompts where your brand appears as a cited source or recommended solution. This has become the headline visibility KPI for 2026.
- Citation share. Of the sources an AI engine cites for your priority prompts, what fraction are yours? Different from mention rate and more defensible.
- Prompt-level coverage. Track a fixed panel of 50 to 200 buyer prompts monthly rather than keywords. Prompts are the new query set.
- Sentiment and positioning accuracy. Being mentioned incorrectly is worse than not being mentioned. Check how models describe your category position.
- Branded search lift. The cleanest downstream proof that AI visibility is working. Rising branded search with flat paid spend is real demand. Related: share of search remains one of the strongest predictors of market share.
Set up this tier the same way you set up rank tracking a decade ago: fixed prompt panel, fixed cadence, competitor set included. Our AI visibility guide walks through the tooling and measurement design.
Tier 5: Marketing Operations KPIs
The tier most teams skip, and the one that explains why the other four are hard to improve. Operational KPIs measure the marketing engine itself.
- Content velocity. Published assets per month per full-time equivalent. Track alongside quality, not instead of it.
- Cycle time from brief to publish. Usually the single biggest constraint on pipeline growth, and usually invisible.
- Cost per asset. Fully loaded, including agency and freelance spend.
- Brand compliance rate. Share of published assets passing brand review on first submission. This gets worse fast when AI output scales without brand guardrails.
- Stack utilization and cost per active seat. With utilization industry-wide near 49%, this KPI routinely finds five figures of annual waste.
- Data freshness. How many hours old is the number on the dashboard? If the answer is more than 24, your weekly decisions are running on last week’s reality.
How to Choose Your KPIs: The Five-Question Test
Run every candidate KPI through these five questions. If it fails two or more, cut it.
- Does it connect to revenue in two hops or fewer? Sessions to pipeline is three hops. Non-brand demo requests to pipeline is one.
- Can we influence it this quarter? KPIs you cannot move in 90 days are strategic context, not operating KPIs.
- Is it hard to game? Any KPI a team can inflate without creating value eventually will be.
- Do we have a reliable, automated source? A KPI that requires manual assembly gets reported late and eventually gets dropped.
- Is there a named owner and a threshold? No owner, no target, no KPI.
How to Build a Marketing KPI Dashboard That Gets Used
Most dashboard projects fail for the same reason: the data pipeline is manual, so the dashboard is stale, so people stop opening it. Build it in this order.
Step 1: Define the decisions first
List the five to eight recurring decisions your team makes (budget reallocation, channel pauses, content investment, hiring). Work backward to the KPIs each decision needs. This alone eliminates half the metrics people ask for.
Step 2: Write the definitions down
Create a one-page metric dictionary. Define exactly what counts as a marketing-sourced opportunity, which spend rolls into CAC, and what window attribution uses. Ambiguous definitions are the most common cause of dashboard distrust.
Step 3: Automate the pipes
Connect ad platforms, analytics, CRM, email, and search data so the dashboard refreshes without a human. This is where marketing reporting software earns its keep, and where most teams discover their marketing tech stack has more overlap than they realized.
Step 4: Build three views, not one
An executive view (tiers 1 and 2, monthly), an operating view (tiers 2 and 3, weekly), and channel views (tier 3 detail, daily). One dashboard for three audiences serves none of them. Our marketing dashboard guide covers layout patterns in detail.
Step 5: Add commentary, not just charts
Every KPI that misses its threshold needs a one-line explanation and a next action. Numbers without narrative get ignored.
This is the gap MarqOps was built to close. Instead of stitching analytics, ads, SEO, and creative reporting across seven or more disconnected tools, one platform pulls them into a single dashboard, so KPI reporting stops being a Monday morning copy-paste ritual and starts being a live view of the business.
Marketing KPI Examples by Team Type
B2B SaaS marketing team
Pipeline sourced, pipeline influenced, SQL acceptance rate, CAC payback, LTV:CAC, win rate by source, non-brand organic demo requests, AI share of voice on category prompts, net revenue retention influence.
Ecommerce marketing team
Marketing efficiency ratio, blended CAC, contribution margin per order, repeat purchase rate, 90-day LTV, email revenue share, product page conversion rate, cost per acquisition by campaign type.
Agency or multi-client team
Client-level ROAS or MER, hours per deliverable, cycle time from brief to publish, retained revenue per client, report delivery timeliness, and brand compliance rate across accounts. Agencies feel tool fragmentation hardest because every client multiplies it. Pulling delivery, reporting, and creative into one AI-powered platform is often the single highest-leverage operational change available.
Content and SEO team
Non-brand qualified sessions, citation share in AI answers, prompt-level coverage, assisted pipeline from content, content velocity per FTE, and cycle time. Traditional ranking positions stay in the diagnostic layer, not the headline.
Seven Mistakes That Kill KPI Programs
- Tracking 60 KPIs. Everything important becomes nothing important. Cap the executive view at eight numbers.
- Reporting activity as achievement. Campaigns launched and assets produced are workload metrics, not outcomes.
- Changing definitions mid-year. Redefining “marketing-sourced” in Q3 destroys the trend line and the credibility with it.
- Ignoring the denominator. Conversion rate improvements mean nothing if traffic quality collapsed to produce them.
- Trusting one attribution model. Triangulate with attribution, mix modeling, and holdout tests. Any single model is a hypothesis.
- Setting targets from published benchmarks. Use your own trailing 90-day performance as the baseline and benchmarks as sanity checks.
- Building the dashboard before fixing the data. A beautiful chart on stale data is worse than no chart, because people act on it.
Putting It Together: A 30-Day Rollout
Week 1. List the recurring decisions. Draft the KPI shortlist by tier. Kill anything that fails the five-question test.
Week 2. Write the metric dictionary. Align with sales and finance on sourced versus influenced revenue and on what spend enters CAC.
Week 3. Connect data sources and automate refresh. Set thresholds and owners for each KPI. Stand up the AI visibility prompt panel while you are at it.
Week 4. Ship three views, run the first review meeting off the dashboard rather than a slide deck, and schedule a quarterly KPI audit to prune what nobody used.
Frequently Asked Questions
What are the 5 most important marketing KPIs?
For most teams: customer acquisition cost, LTV:CAC ratio, CAC payback period, marketing-sourced pipeline, and conversion rate at the primary funnel step. Those five cover efficiency, profitability, and forward-looking demand. Everything else supports them.
What is the difference between a KPI and a metric in marketing?
A metric is any measurable number. A KPI is a metric tied to a target, an owner, and a business decision. Page views are a metric. Cost per qualified opportunity against a $400 threshold is a KPI.
How many marketing KPIs should a team track?
Roughly 12 to 18 across all five tiers, with no more than eight on the executive view. Below that you lack diagnostic depth. Above it, attention fragments and nothing gets acted on.
Is MQL still a useful marketing KPI in 2026?
As a channel diagnostic, yes. As a headline KPI, no. With MQL-to-SQL conversion around 13% and under 1% of leads ever closing, MQL volume does not predict revenue reliably. Report pipeline sourced and influenced instead, and keep MQL in the tactical layer.
What is a good LTV to CAC ratio?
Three to one is the standard target. Median B2B SaaS performance in 2026 is about 3.2:1, and companies past $10M ARR often hit 3.8:1 to 5:1. Consistently above 5:1 usually signals underinvestment in growth rather than exceptional efficiency.
How do I measure marketing KPIs when AI search sends fewer clicks?
Add a visibility tier. Track AI share of voice, citation share across a fixed prompt panel, and branded search lift, then connect those to pipeline through assisted conversions and self-reported attribution on forms. Session count alone will understate the impact of AI-era search.
What are good digital marketing KPIs for a small team?
Start with five: blended CAC, conversion rate on your primary action, cost per qualified lead, email revenue or pipeline contribution, and non-brand organic sessions. Add the pipeline and AI visibility tiers once those five are automated and trusted.
How often should marketing KPIs be reviewed?
Channel KPIs weekly, pipeline KPIs weekly, revenue KPIs monthly, brand and AI visibility monthly, and a full KPI audit quarterly to retire anything nobody used. The audit matters as much as the reviews.
The Bottom Line
Marketing KPIs are not a reporting exercise. They are the interface between marketing and the rest of the business, and in a year where 64% of CMOs name proving value as their top challenge, that interface is the job. Pick fewer numbers, define them precisely, automate the data behind them, and add the AI visibility tier before your competitors do.
Then make sure they live in one place. Unified reporting is what turns a KPI list into an operating system: analytics, ads, SEO, and creative performance in a single view, refreshed automatically, with brand-consistent output flowing from the same platform that measures it. That is what MarqOps replaces seven tools to do.
Keep following the signal