Client Reporting in 2026: The Framework Agencies Actually Need
Manual client reporting costs 5 to 10 hours per client every month. Here is the five layer framework, what to automate, and what to never let AI write unchecked.
Ask an agency owner what their client reporting process is and you will usually hear a tool name. Ask what happens between the tool producing a dashboard and the client understanding what to do about it, and the answer gets longer, vaguer, and usually involves somebody's Sunday evening.
That gap is where the money is. Manual reporting costs between 5 and 10 hours per client per month at most agencies, and account managers running a book of 8 to 12 accounts lose 4 to 7 hours a week to it. None of that time is billable, almost none of it is analysis, and clients do not experience any of it as value. They experience the twelve pages that land in their inbox on the fourth of the month.
Meanwhile the thing the report is supposed to do, which is keep the client convinced that the retainer is working, has become measurably harder. Attribution is leakier than it was three years ago, a growing share of discovery now happens inside AI assistants that return no referrer, and clients under CFO pressure have stopped accepting impressions as evidence of anything. This guide covers what client reporting has to accomplish in 2026, the five layers of a report that survives scrutiny, what to automate and what to never automate, and how to verify an AI written report before it reaches a client.
Contents
- What client reporting actually means in 2026
- The hidden cost of the monthly report
- Reporting is a retention mechanism, not an admin task
- The five layers of a report that survives scrutiny
- What belongs in a 2026 report that did not belong in 2023
- Automating client reporting without importing the errors
- A verification workflow for AI written reports
- A four week rollout
- Five mistakes that keep showing up
- Where MarqOps fits
- Frequently asked questions
What client reporting actually means in 2026
Client reporting is the recurring account an agency gives a client of what was spent, what it produced, and what changes as a result. The definition is boring and the practice is not, because those three clauses pull in different directions. The first is a matter of record. The second is a matter of measurement, which in 2026 is contested ground. The third is a judgment call that no dashboard makes for you.
Most of the category confusion comes from collapsing reporting into dashboarding. A dashboard is a live surface a client can look at whenever they want. A report is an argument made at a point in time, with a recommendation attached. Clients need both and they are not substitutes. The dashboard answers what is happening right now. The report answers whether the strategy is working and what you propose to do about it.
The distinction matters practically, because it decides what you automate. Dashboards should be fully automated: they are a data pipeline problem. Reports are partly automated at best, because the recommendation is the product and the recommendation is the part a model cannot be trusted to originate.
The hidden cost of the monthly report
Reporting is the single largest non billable line in most agency operations, and it is almost never measured as such. The figures below come from agency benchmarking across the last two years and they are consistent enough to plan against.
| Signal | Figure | Source |
|---|---|---|
| Time per client per month, manual reporting | 5 to 10 hours | AgencyAnalytics benchmarks |
| Account manager time per week on reporting | 4 to 7 hours | Agency benchmarking, 8 to 12 account books |
| Time per week on report prep across 450 agencies | 12 to 15 hours | Databox State of Agency Reporting |
| Agencies saving 5+ hours a week using AI | 79% | AgencyAnalytics 2026 Benchmarks |
| Agencies citing reporting as their top AI use case | 42% | AgencyAnalytics 2026 Benchmarks |
| Time per client with a consolidated reporting platform | 45 minutes or less | AgencyAnalytics 2026 Benchmarks |
Run the arithmetic on a fifteen client book at the midpoint and you get roughly 112 hours a month, which is most of a full time role. The uncomfortable part is what that time is spent on. It is not analysis. It is logging into six platforms, exporting, reconciling date ranges that do not agree, rebuilding the same chart, screenshotting, and formatting a deck.
The reason it takes that long is structural rather than a discipline problem. The average marketing team now runs somewhere between 80 and 121 tools, and 61.4% of teams report data connection issues between them. Every platform that does not talk to the next one adds a manual export to the monthly cycle. Consolidating the stack is the only intervention that changes the shape of the curve rather than shaving minutes off it.
Reporting is a retention mechanism, not an admin task
The strongest argument for taking reporting seriously is not efficiency. It is that reporting quality shows up in churn data, and churn is the number that decides whether an agency compounds or treads water.
| Agency type or practice | Annual churn | Note |
|---|---|---|
| PPC agencies | 49% | Highly comparable metrics make switching easy |
| Social media agencies | 46% | Outcome attribution is weakest here |
| SEO agencies | 38% | Expectation gaps on timeline |
| Performance based model | 33% | Churn follows performance swings |
| Retainer based model | 18% | Average client lifespan around 56 months |
| Clients engaging with narrative reporting | 9% | Versus 31% for clients who do not engage |
The last row is the one worth sitting with. The difference between a client who reads a report that explains why a number moved and a client who receives a PDF of charts is not marginal. It is the difference between a relationship that survives a bad quarter and one that does not, because a client who understands the mechanism will forgive a dip they can see you diagnosing. A client who only sees the dip will start taking calls.
This is also why PPC carries the highest churn in the industry. Paid media produces clean, comparable numbers that any competitor can undercut in a pitch deck. The defence is not better numbers, it is better explanation: showing the client the search term waste you removed, the budget you reallocated, and the incrementality question you are actually testing.
The five layers of a report that survives scrutiny
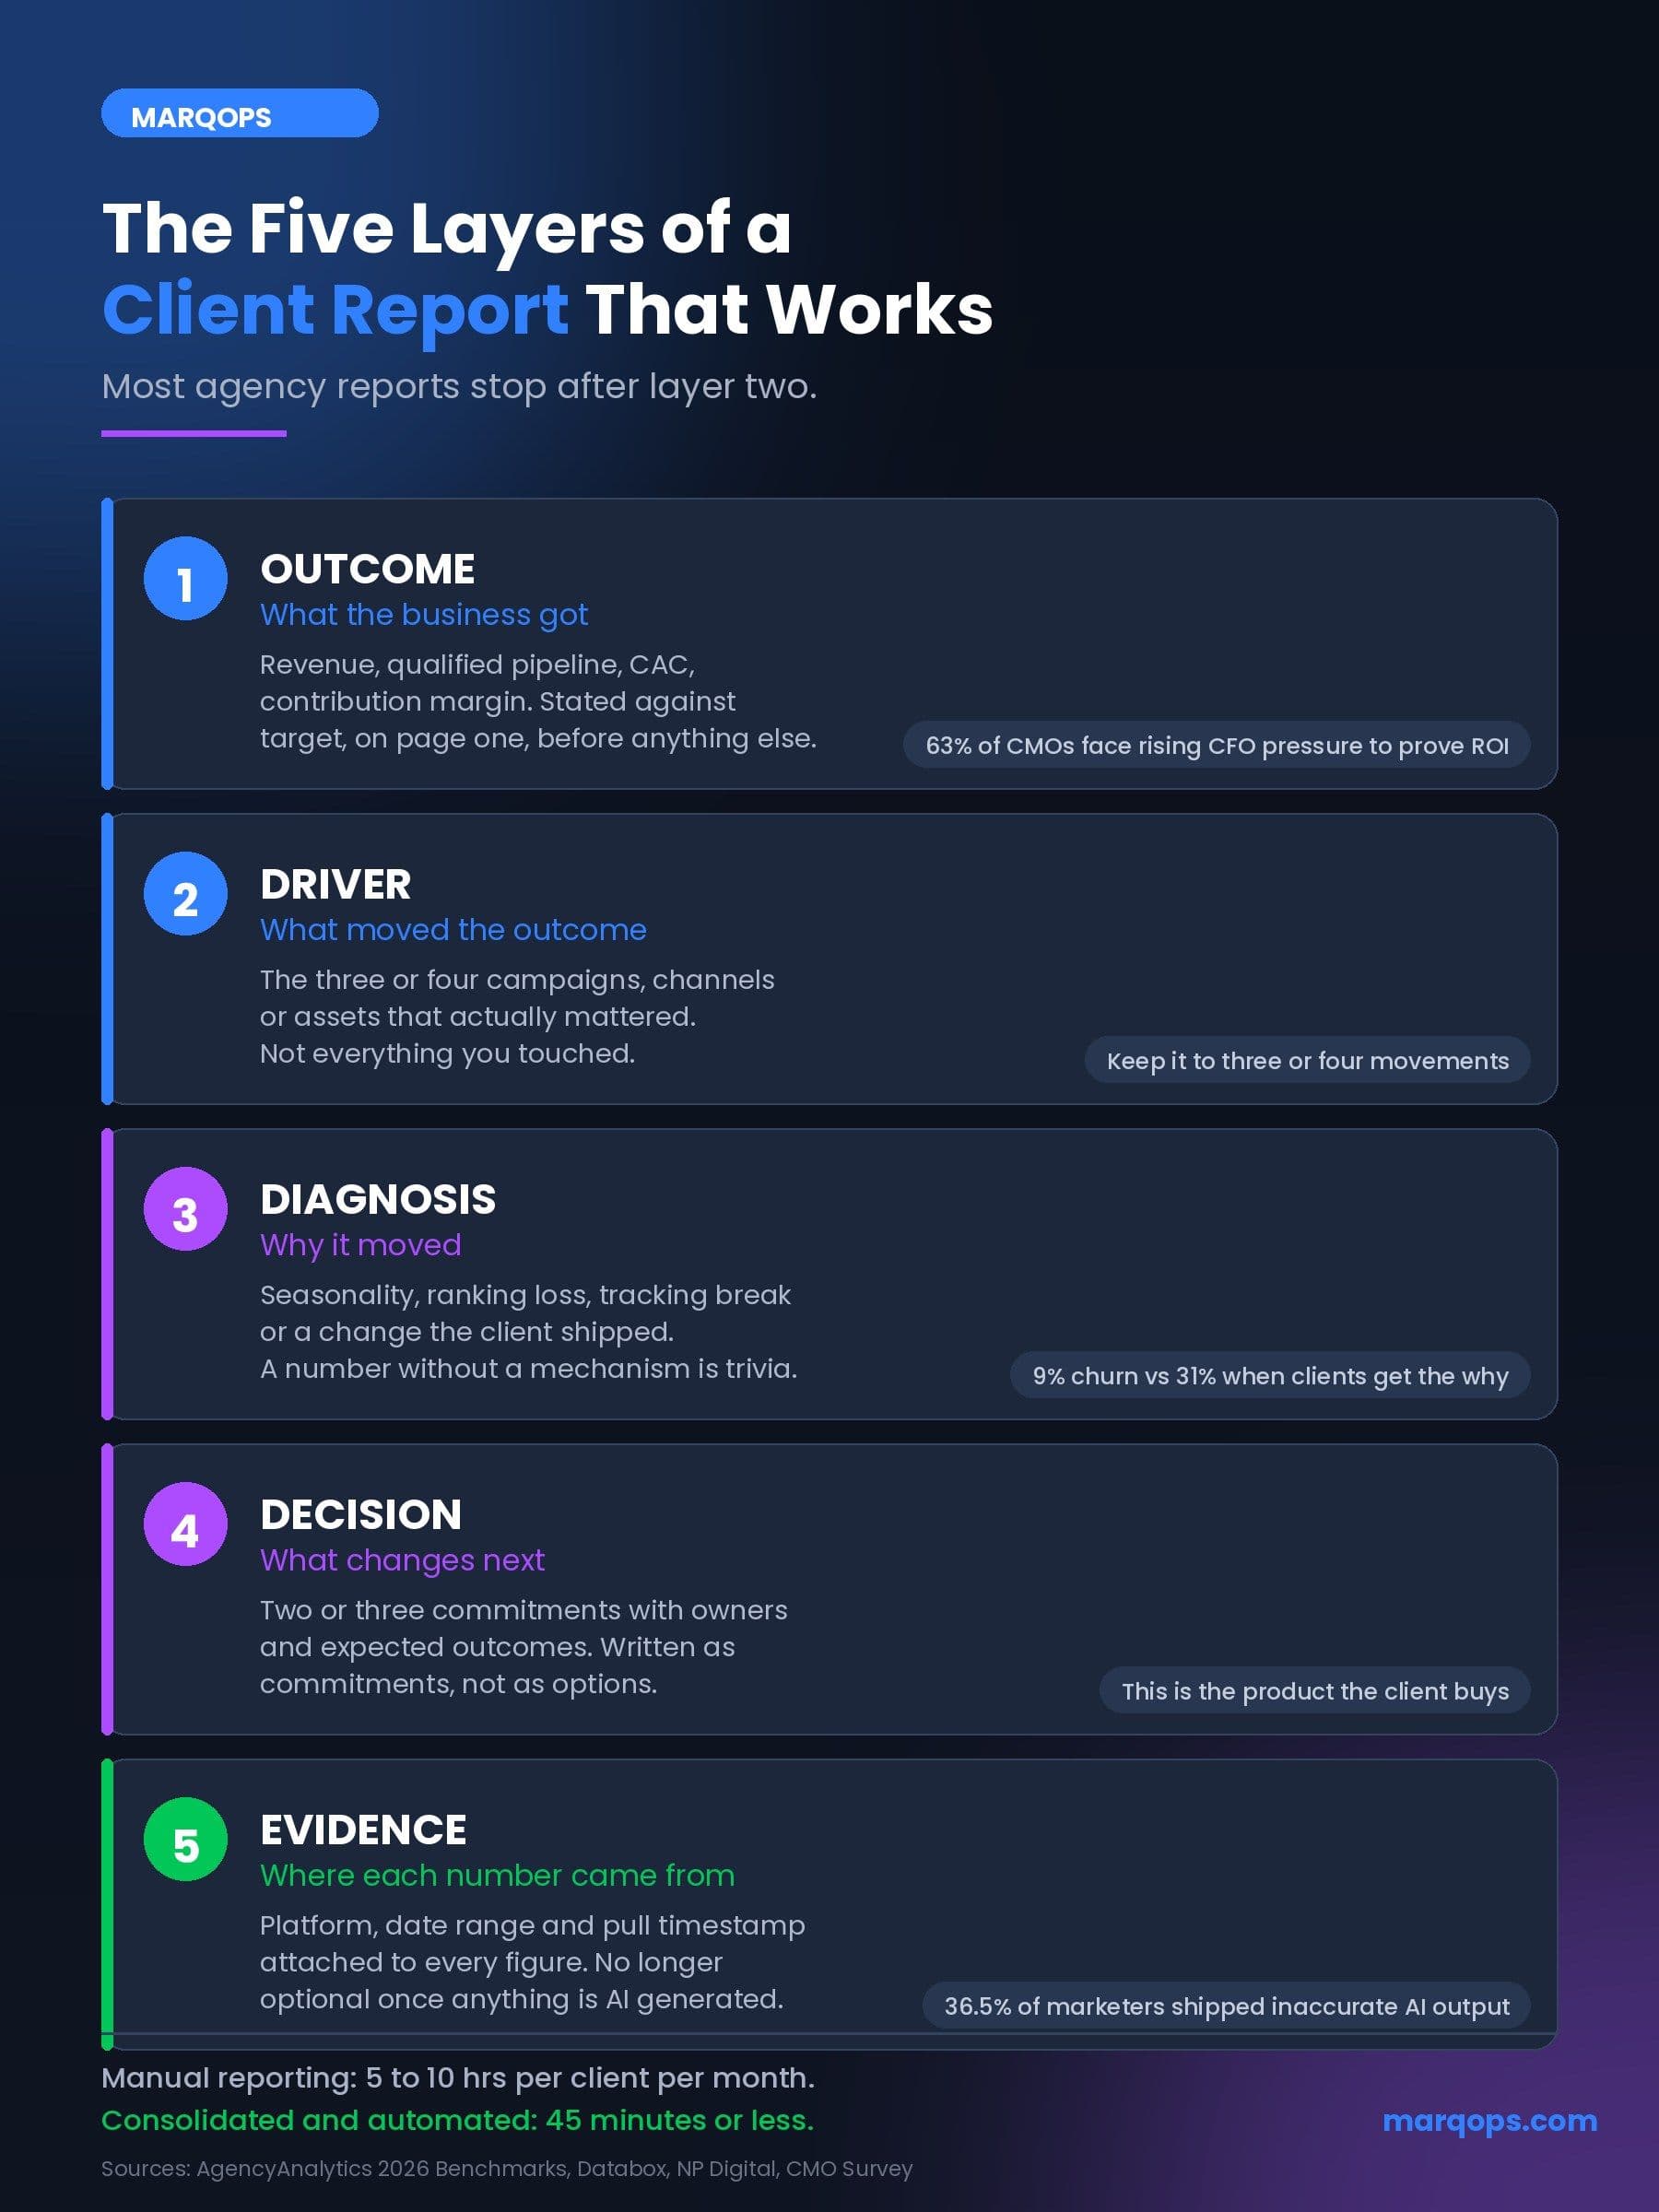
A report that holds up under a CFO's questioning has five layers, in this order. Most agency reports contain layers one and two and stop, which is why they read as activity logs.
1. Outcome
What the business got. Revenue, qualified pipeline, cost per acquisition, contribution margin. This goes at the top of page one, before anything else, and it is stated against the target rather than against last month. Pressure from finance is now the dominant force here: 63% of CMOs report increased pressure from their CFO to prove return, and that pressure travels straight down to the agency.
2. Driver
Which channel, campaign, or asset moved the outcome. This is where the report earns the retainer, because it is the first layer a client cannot produce for themselves. Keep it to the three or four movements that actually mattered and resist the urge to show everything you touched.
3. Diagnosis
Why it moved. A number without a mechanism is trivia. If organic conversions fell 14%, the report has to say whether that was seasonality, a ranking loss on three commercial pages, a tracking break, or a landing page change the client's own team shipped. Getting this wrong in either direction is costly, and getting it right is the single strongest retention signal in the data above.
4. Decision
What changes next month, who owns it, and what it is expected to produce. Two or three items, written as commitments rather than options. A report without a decision layer puts the client in the position of having to decide what to do with information they are paying you to interpret.
5. Evidence
Where each number came from and when it was pulled. This layer used to be optional. It is not optional once any part of the report is machine generated, for reasons covered below, and it is the layer that makes a disputed number a two minute conversation instead of a two day fire drill.
What belongs in a 2026 report that did not belong in 2023
Two additions and one subtraction. The additions are AI search visibility and a declared measurement gap. The subtraction is every metric that survived in the report only because it was easy to export.
AI search visibility now belongs next to organic
A meaningful share of discovery has moved into assistants that do not send a click. Only about 22% of marketers currently track AI visibility at all, which means adding it is still a differentiator in a pitch rather than table stakes. Four measures carry most of the value: share of voice across assistant answers for your client's commercial queries, citation rate, AI referral traffic, and sentiment of the mentions.
Referral traffic alone understates the effect and will make you look wrong. Similarweb's 2026 research found that users who receive an AI recommendation are roughly 2.5 times more likely to arrive through branded search rather than through a referral link. If your report treats AI referral sessions as the whole of AI's contribution, you will under report the channel and over attribute the result to brand.
The GA4 AI Assistant channel changed what is defensible
On 13 May 2026 Google added a native AI Assistant channel to the GA4 Default Channel Group. Traffic from recognised assistants including ChatGPT, Gemini and Claude is now assigned an ai-assistant medium automatically and separated out of the Referral bucket, with no configuration required. Practically, this means a client can open their own GA4 property and see a number your report does not mention, which is a bad way for the conversation to start.
It has a known limit worth stating in the report itself: assistant traffic arriving without a referrer header, which includes in app browsers and copied links, still lands in Direct. So the channel is a floor on assistant driven traffic, not a measurement of it.
Declare the gap instead of papering over it
Most of what happens inside an assistant conversation leaves no trace in a web log, consent rates cap what analytics can see, and cross device journeys are partly reconstructed. A report that presents a complete looking picture of an incomplete reality is setting up a credibility loss later. Stating plainly which parts of the funnel are modelled, which are observed, and which are dark is the more durable position, and it is what makes an incrementality test worth commissioning when the stakes justify it.
Automating client reporting without importing the errors
Automation is the obvious answer to a 112 hour monthly bill, and it works. 79% of agencies now save five or more hours a week using AI, and reporting is the leading use case at 42%. Teams on a consolidated platform report spending 45 minutes or less per client. The gains are real and they are large.
The cost arrives somewhere else. AI written reports fail in a specific way: they fail confidently and they fail fluently. A fabricated figure in a generated summary reads exactly like a correct one, which means the error surfaces in a client meeting rather than in review.
The useful way to think about this is not automation versus manual, it is deciding which parts of the report are retrieval problems and which are judgment problems. Retrieval automates cleanly. Judgment does not.
| Report component | Automate? | Why |
|---|---|---|
| Data collection and normalisation | Fully | Deterministic, and the largest time sink |
| Period over period calculations | Fully | Arithmetic, verifiable against source |
| Chart and layout generation | Fully | Formatting carries no interpretive risk |
| Anomaly flagging | Fully | Machines beat humans at spotting the outlier |
| Narrative summary of what moved | Draft only | Fluent and confident even when wrong |
| Diagnosis of why it moved | Draft only | Requires context the model does not hold |
| Recommendations and next month's plan | Never | This is the product the client is buying |
| Anything stated as a causal claim | Never unverified | Highest blast radius when wrong |
The pattern generalises beyond reporting. Agents that retrieve and calculate can run with light supervision. Agents that assert things to clients need a gate in front of them, which is the same conclusion the wider governance literature reaches.
A verification workflow for AI written reports
Verification has to happen against source data rather than against how plausible the output sounds. The workable pattern is a three state review applied to every material claim before the report leaves the building.
- Verified. The claim matches a source you can point to, with the platform, the date range, and the pull timestamp attached.
- Needs context. The relationship is real but the framing overstates it. Correlation presented as cause is the common case here, and it is the one that gets agencies into trouble in quarterly business reviews.
- Unsupported. There is no evidence behind it. Unsupported claims are removed rather than softened, because a softened fabrication is still a fabrication.
Three practices make this cheap enough to actually do every month. First, attach the source to the number at generation time rather than reconstructing it during review, which turns a research task into a glance. Second, review only the claims, not the whole document, since the arithmetic and the formatting do not need a human. Third, keep the record of who approved what, so a number that turns out to be wrong has an owner and a fix rather than an argument.
None of this is exotic. It is the same evidence discipline good analysts already apply informally, written down so it survives volume, staff turnover, and the temptation to ship on the fourth of the month regardless.
A four week rollout
For an agency with an existing reporting habit and no appetite for a transformation programme.
Week one: measure the current cost
Time three reporting cycles honestly, including the reconciliation and the chasing. Most agencies discover the real figure is between 1.5 and 2 times what they assumed, because the assumed figure only counts the assembly and not the data gathering. You cannot justify the change without this number.
Week two: fix the template before touching tooling
Rebuild one client report around the five layers. Cut every metric that fails the so what test. Expect the report to get shorter by roughly half, and expect that to feel wrong before it feels obviously correct. Do this before you evaluate platforms, because otherwise you will automate the wrong report faster.
Week three: consolidate the data sources
Connect the platforms that feed the new template into one place so the monthly export ritual stops. This is the step that delivers most of the time saving, and it is also the step that surfaces every definitional disagreement you have been quietly living with, such as three tools reporting three different conversion counts. Resolve those now and document the definitions in the report itself.
Week four: automate assembly, gate the claims
Turn on automated collection, calculation and drafting. Put the claim review in front of delivery. Run it in parallel with the old process for one cycle so you can compare outputs, then retire the old process. Agencies that white label their deliverables should confirm the evidence trail survives the rebrand, since that is a common place for source attribution to get stripped.
Five mistakes that keep showing up
- Reporting on everything available. Length reads as effort to the agency and as evasion to the client. If the report has forty metrics, the client concludes you do not know which three matter.
- Leading with channel performance instead of business outcome. The client does not open the report wondering about click through rate. They open it wondering whether the money worked.
- Changing the metric set when results are poor. Clients notice, and it costs more trust than the bad month would have.
- Treating the dashboard as the report. A live dashboard with no recurring argument attached trains the client to believe the analysis is something they could do themselves.
- Shipping AI drafted narrative without claim review. This is the newest mistake and the fastest growing one. The output is fluent, which is exactly why nobody proofreads it properly.
Where MarqOps fits
Most of the reporting cost described above is a consequence of fragmentation. Analytics sits in one tool, paid media in another, SEO in a third, creative in a fourth, and the monthly report is the ritual of hand reconciling them. MarqOps replaces seven or more of those disconnected tools with a single platform, which removes the export and reconcile cycle rather than speeding it up.
Three parts matter specifically for client reporting. The unified dashboard pulls analytics, ads, SEO and creative into one surface, so period over period figures agree by construction rather than by reconciliation. Brand Intelligence DNA keeps generated narrative in the client's voice and within their claim boundaries, which is what makes a drafted summary usable rather than a rewrite. And the review layer attaches source context, human approval and an activity trail to consequential output, which is the verification workflow above expressed as product rather than as process discipline.
For agencies running multiple client brands, the same model applies per brand, which is the practical difference between reporting getting linearly more expensive with each account and staying roughly flat.
Frequently asked questions
What is client reporting?
Client reporting is the recurring account an agency or in house team gives a client of what was spent, what it produced, and what changes as a result. A complete report covers the business outcome, the channel or campaign that drove it, a diagnosis of why it moved, the decisions for the next period, and the evidence behind each number. It is distinct from a dashboard, which is a live data surface with no argument or recommendation attached.
What are the best practices for client reporting?
Lead with business outcome rather than channel activity, keep a stable metric set so results stay comparable month to month, explain why each number moved rather than only that it moved, end with two or three owned decisions, and attach sources to every figure. Cut any metric that would not change what the client does. Agencies whose clients engage with reporting that explains the mechanism see roughly 9% annual churn, against 31% for clients who do not.
How do you write a client report?
Start from the outcome against target, then identify the three or four movements that explain it, then diagnose each one against source data rather than intuition. Write the decisions before you write the commentary, because the decisions determine which context is relevant. Draft with AI if you like, but verify every causal claim against evidence before delivery, since 36.5% of marketers report that inaccurate AI output has already reached the public.
How long should client reporting take?
Manual reporting runs 5 to 10 hours per client per month at most agencies, with account managers losing 4 to 7 hours a week across a book of 8 to 12 accounts. On a consolidated platform with automated collection and assembly, 78% of agencies get it to 45 minutes or less per client. The time that remains should be spent on diagnosis and recommendation, which are the parts that cannot be automated.
Should client reports include AI search visibility?
Yes, and in 2026 it is still a differentiator rather than an expectation, since only about 22% of marketers track it. Report share of voice in assistant answers, citation rate, AI referral traffic and sentiment. Do not report referral sessions alone as the full picture: AI recommendations make users roughly 2.5 times more likely to arrive through branded search, so referral traffic understates the channel's contribution.
The bottom line
Client reporting sits in an awkward place: too operational to get strategic attention, too visible to get away with being bad. The result is that most agencies spend a full time role's worth of hours a month producing the artefact their clients use to decide whether to keep paying them, and spend almost none of that time on the part the client actually values.
The fix is not a better template, although a better template helps. It is separating the two jobs the monthly report is doing. Collecting, reconciling and formatting is a data problem, it is solved, and it should cost 45 minutes rather than eight hours. Diagnosing what happened and committing to what changes next is the product, it cannot be automated, and it should get the hours the formatting used to eat.
Automation makes that reallocation possible. Verification is what stops it becoming a liability. Run both and the monthly report stops being the thing you dread on the third of the month and starts being the reason the client renews.
Keep following the signal