Multi-Touch Attribution in 2026: The AI-Powered Guide to Measuring True Marketing ROI
Master multi-touch attribution in 2026 with this AI-powered guide. Compare attribution models, fix iOS privacy gaps, and lift marketing ROI by 18%.
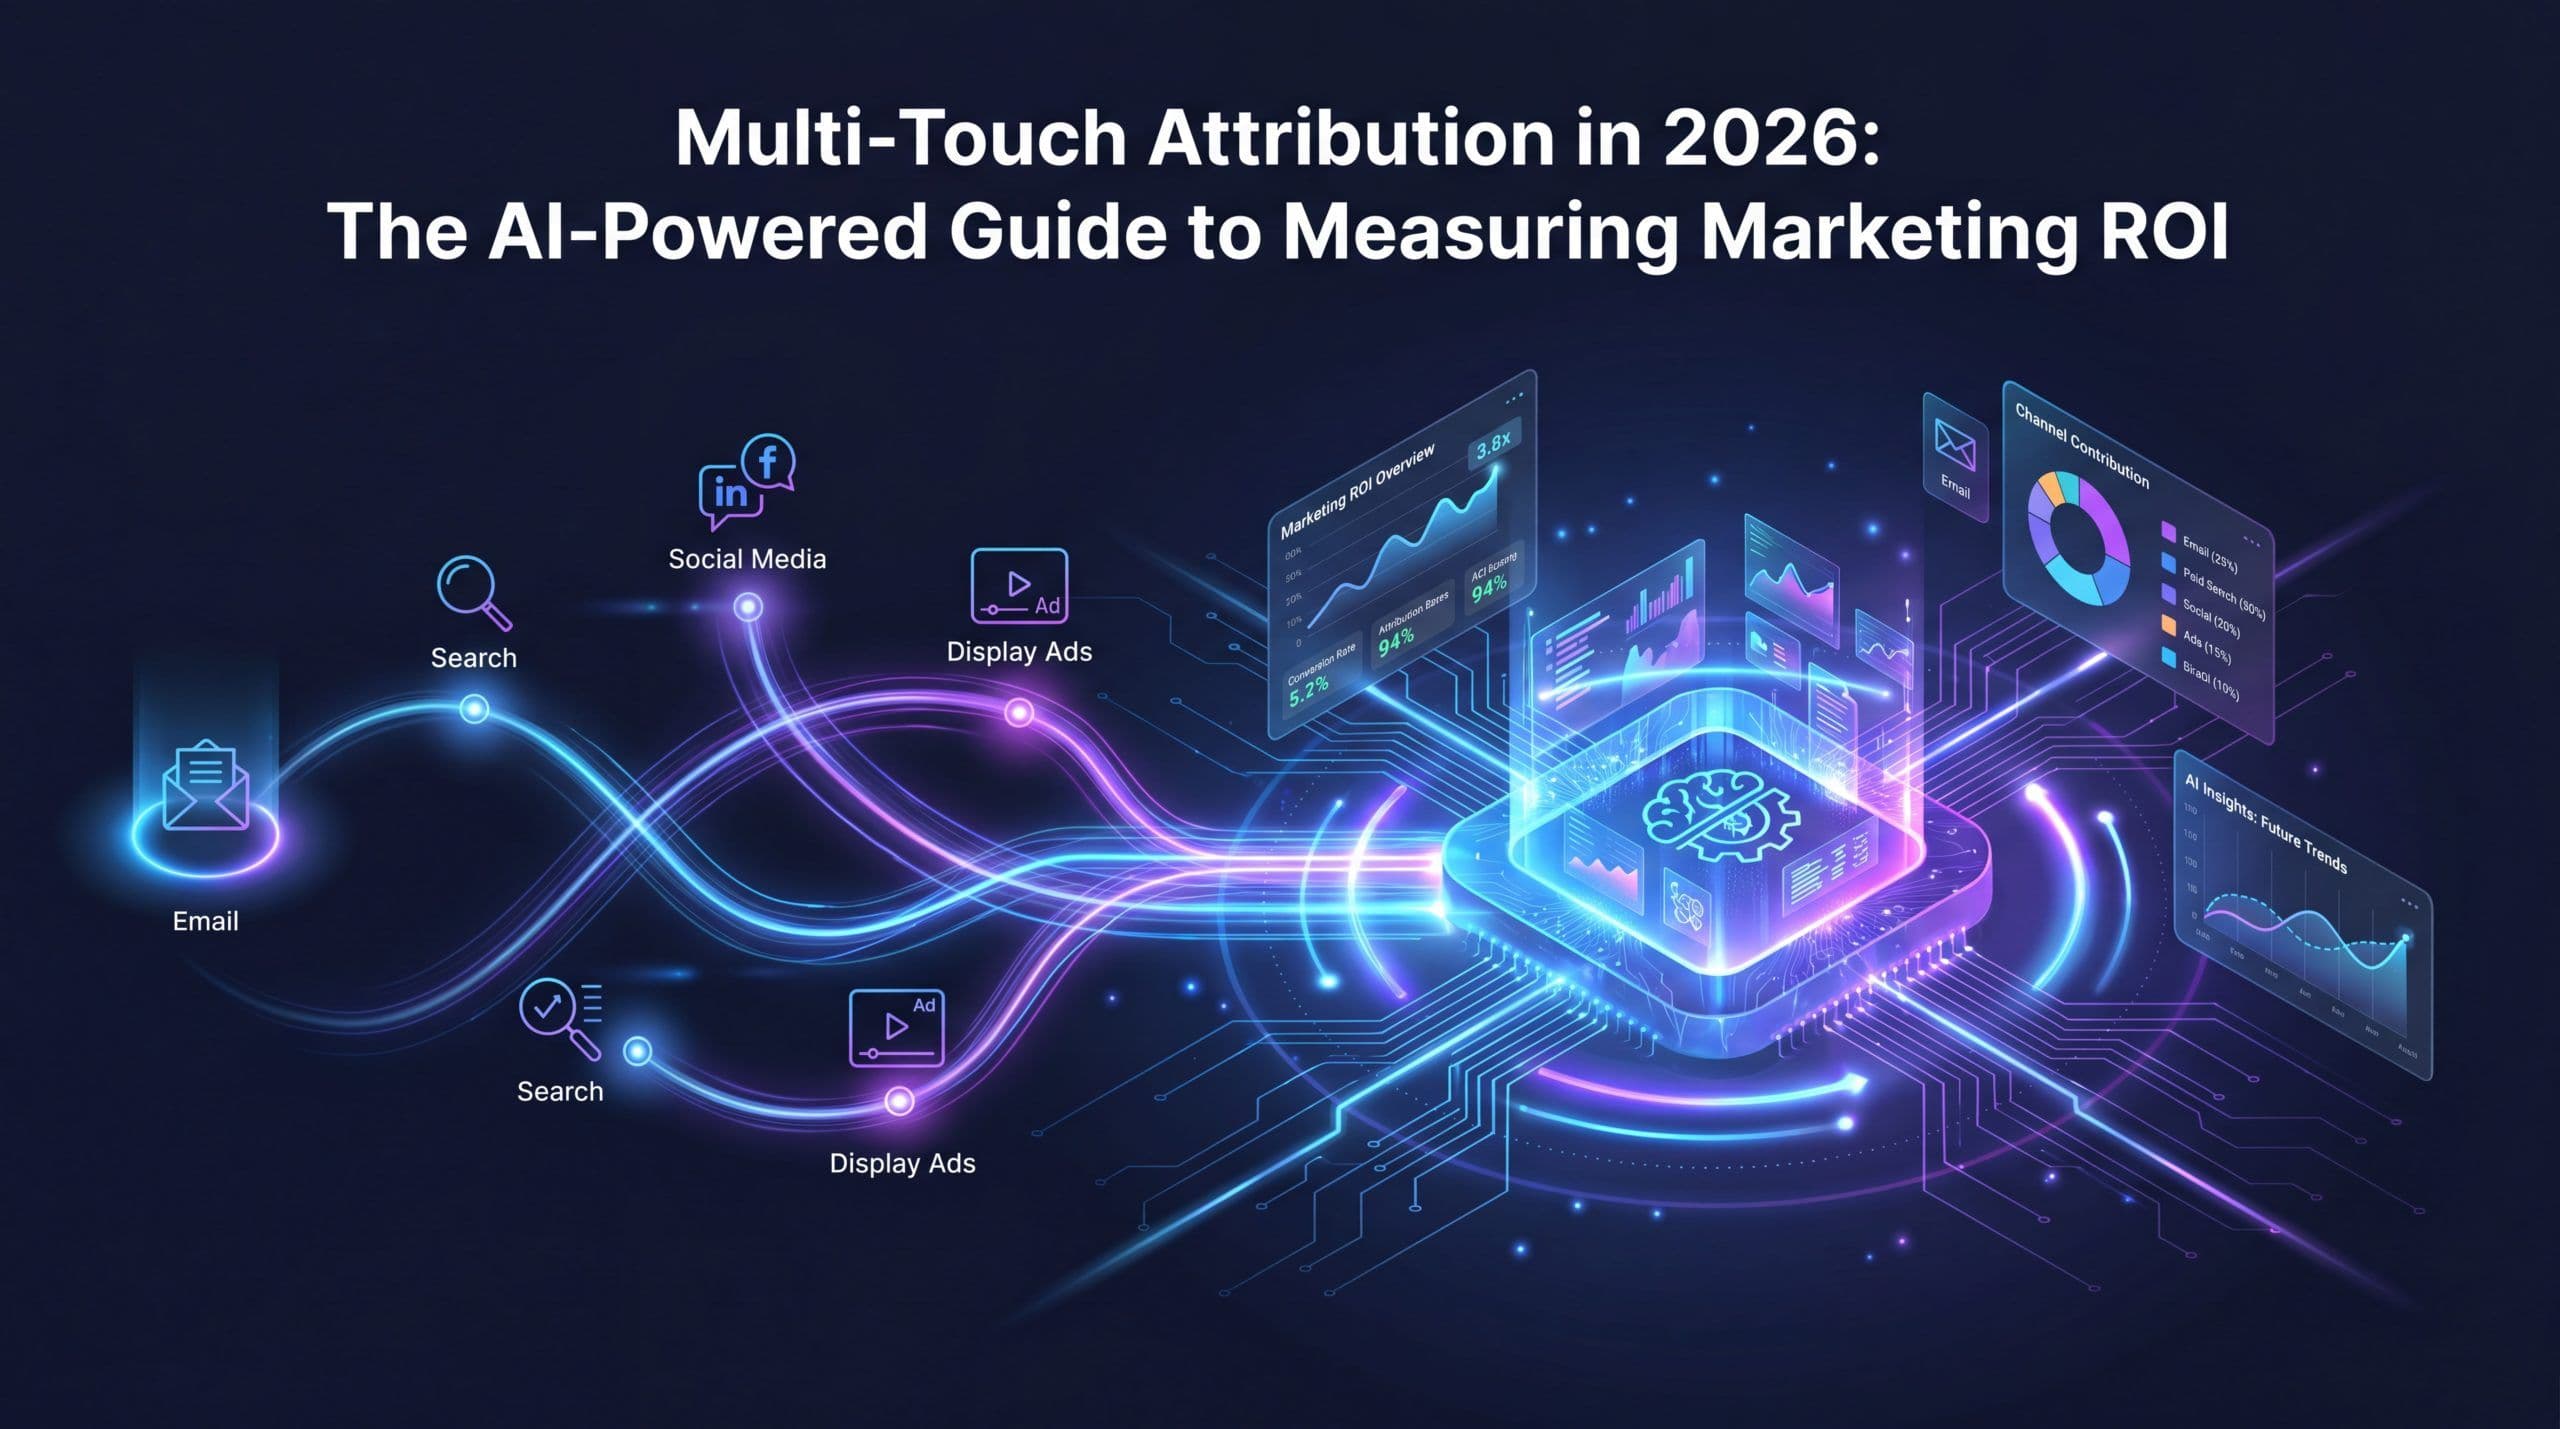
Multi-touch attribution dashboard showing marketing ROI across channels
TL;DR
- Multi-touch attribution (MTA) assigns credit across every touchpoint in a buyer’s journey, not just the last click. It is how modern marketers answer the question: which channels actually drove revenue?
- Only 41% of teams have adopted multi-touch attribution, yet 67% of B2B marketers still rely on last-touch reporting. The teams that have switched report an 18% average ROI lift, 22% better lead quality, and 15% lower CAC.
- AI fixes the two biggest MTA problems: messy data across channels and the 30 to 40% signal loss from iOS privacy and cookie deprecation. Machine learning attribution recovers 60 to 75% of that lost signal.
- Pick the right attribution model (data-driven beats rule-based in almost every case), stitch it to a layered measurement stack with marketing mix modeling and incrementality testing, then act on the insights inside a unified platform.
- MarqOps unifies attribution, customer journey analytics, creative, SEO, and paid ads in one dashboard so you can replace 7+ disconnected tools and reallocate budget in real time.
Table of Contents
- What Is Multi-Touch Attribution?
- Why Attribution in Marketing Matters More Than Ever in 2026
- Marketing Attribution Models Compared
- How AI Is Rebuilding Multi-Touch Attribution
- The Post-Cookie Attribution Playbook
- A 6-Step Implementation Framework
- Marketing Attribution Tools and Software in 2026
- How to Act on Attribution Data
- Common Pitfalls to Avoid
- FAQs
What Is Multi-Touch Attribution?
Multi-touch attribution is a measurement approach that assigns fractional credit to every marketing touchpoint that influenced a conversion, from the first impression to the last click. Instead of giving 100% of the credit to the last ad someone saw, multi-touch attribution distributes that credit across the full journey: the LinkedIn ad that introduced your brand, the newsletter that kept it top of mind, the retargeting display that pulled them back, and the branded search that finally converted.
If you have been asking “what is attribution in marketing?” the answer is simple: it is the math that tells you which marketing activities are actually producing revenue, so you can spend more on what works and less on what does not. Multi-touch attribution is the version of that math that respects how buyers actually shop in 2026, which is across 7 to 15 touchpoints spread over days or weeks.
The problem is that most teams still do not run it. Adoption sits at just 41%, and only 18% of those implementations are rated as highly accurate by their own marketing teams (Digital Applied, 2026). Meanwhile, 67% of B2B teams are still making budget decisions off last-touch data, which systematically undervalues top-of-funnel work and overfunds bottom-of-funnel channels that would have converted anyway.
Plain definition: Multi-touch attribution splits conversion credit across every marketing interaction in a buyer’s path, giving you a full-funnel picture of what really drives pipeline and revenue.
Why Attribution in Marketing Matters More Than Ever in 2026
Three forces have turned attribution from a “nice to have” into a survival skill for modern marketers:
1. Buyer journeys are longer and noisier. A mid-market B2B deal now averages 12 touchpoints across 6 channels before a sales-qualified opportunity. A DTC purchase averages 7 touchpoints. Last-touch attribution hides 80% of that journey.
2. Privacy regulation has gutted traditional tracking. iOS App Tracking Transparency, Chrome’s third-party cookie phaseout, and regulations like GDPR and CPRA have eliminated 30 to 40% of previously trackable conversions. Teams still using legacy pixel-based attribution are flying blind on nearly half their budget.
3. CFOs want proof. In an environment where every marketing dollar is scrutinized, 78% of marketers say attribution is their top priority, but only 32% feel prepared for the cookieless era (GrowthMarketer, 2026). Organizations that close this gap see an average 18% lift in marketing ROI, 22% better lead quality, and 15% lower customer acquisition cost.
18% ROI lift
Average improvement for teams running multi-touch attribution vs. last-touch
The multi-touch attribution software market is growing accordingly, from $2.3B in 2026 to a projected $6.2B by 2033 at a 15.1% CAGR. Attribution is becoming the connective tissue of the modern martech stack, and teams that ignore it are losing ground fast. For the broader context on where this fits in your martech setup, see our complete marketing operations guide.
Marketing Attribution Models Compared
Before choosing a multi-touch model, it helps to see the full set of options side by side. Here are the seven marketing attribution models you will encounter, with honest notes on when each one works.
1. Last-Touch Attribution
How it works: 100% of credit goes to the final interaction before conversion.
Best for: Almost nothing in 2026. It is simple to implement but systematically overfunds bottom-of-funnel channels like branded search and undercuts awareness-building work that created the demand in the first place.
2. First-Touch Attribution
How it works: 100% of credit goes to the first interaction.
Best for: Demand generation teams measuring top-of-funnel awareness. Flawed as a full-funnel view because it ignores everything after the first click.
3. Linear Attribution
How it works: Equal credit to every touchpoint.
Best for: A quick upgrade from single-touch. Works for long B2B journeys where every channel played a role, but treats a random display impression the same as a sales call, which is rarely accurate.
4. Time-Decay Attribution
How it works: Touchpoints closer to conversion get more credit.
Best for: Short sales cycles (DTC, SaaS free trials) where recency is a reasonable proxy for influence.
5. Position-Based (U-Shaped or W-Shaped) Attribution
How it works: Weights the first and last (U-shaped) or first, middle, and last (W-shaped) touchpoints more heavily.
Best for: Teams that want to honor both demand creation and demand capture without going fully algorithmic.
6. Data-Driven (Algorithmic) Attribution
How it works: Machine learning identifies patterns across millions of paths and assigns credit based on statistical contribution, not a fixed rule.
Best for: Anyone with enough conversion volume (typically 500+ conversions per month per model) to train the algorithm. This is the model most enterprises should be using in 2026, and it is what Google Ads data-driven attribution, Adobe Analytics, and most modern platforms default to.
7. Marketing Mix Modeling (MMM)
How it works: Top-down statistical model that measures incremental contribution of each channel to revenue, including offline channels like TV and out-of-home. Does not need individual user tracking.
Best for: A complement to MTA, not a replacement. Pair the two to get both full-funnel attribution at the user level and incremental lift at the channel level.
Which one should you use? For most marketing teams in 2026, the answer is a layered stack: data-driven multi-touch attribution as the primary lens, marketing mix modeling for channel-level incrementality, and holdout-group incrementality tests to validate both. We unpack this stack in detail below.
How AI Is Rebuilding Multi-Touch Attribution
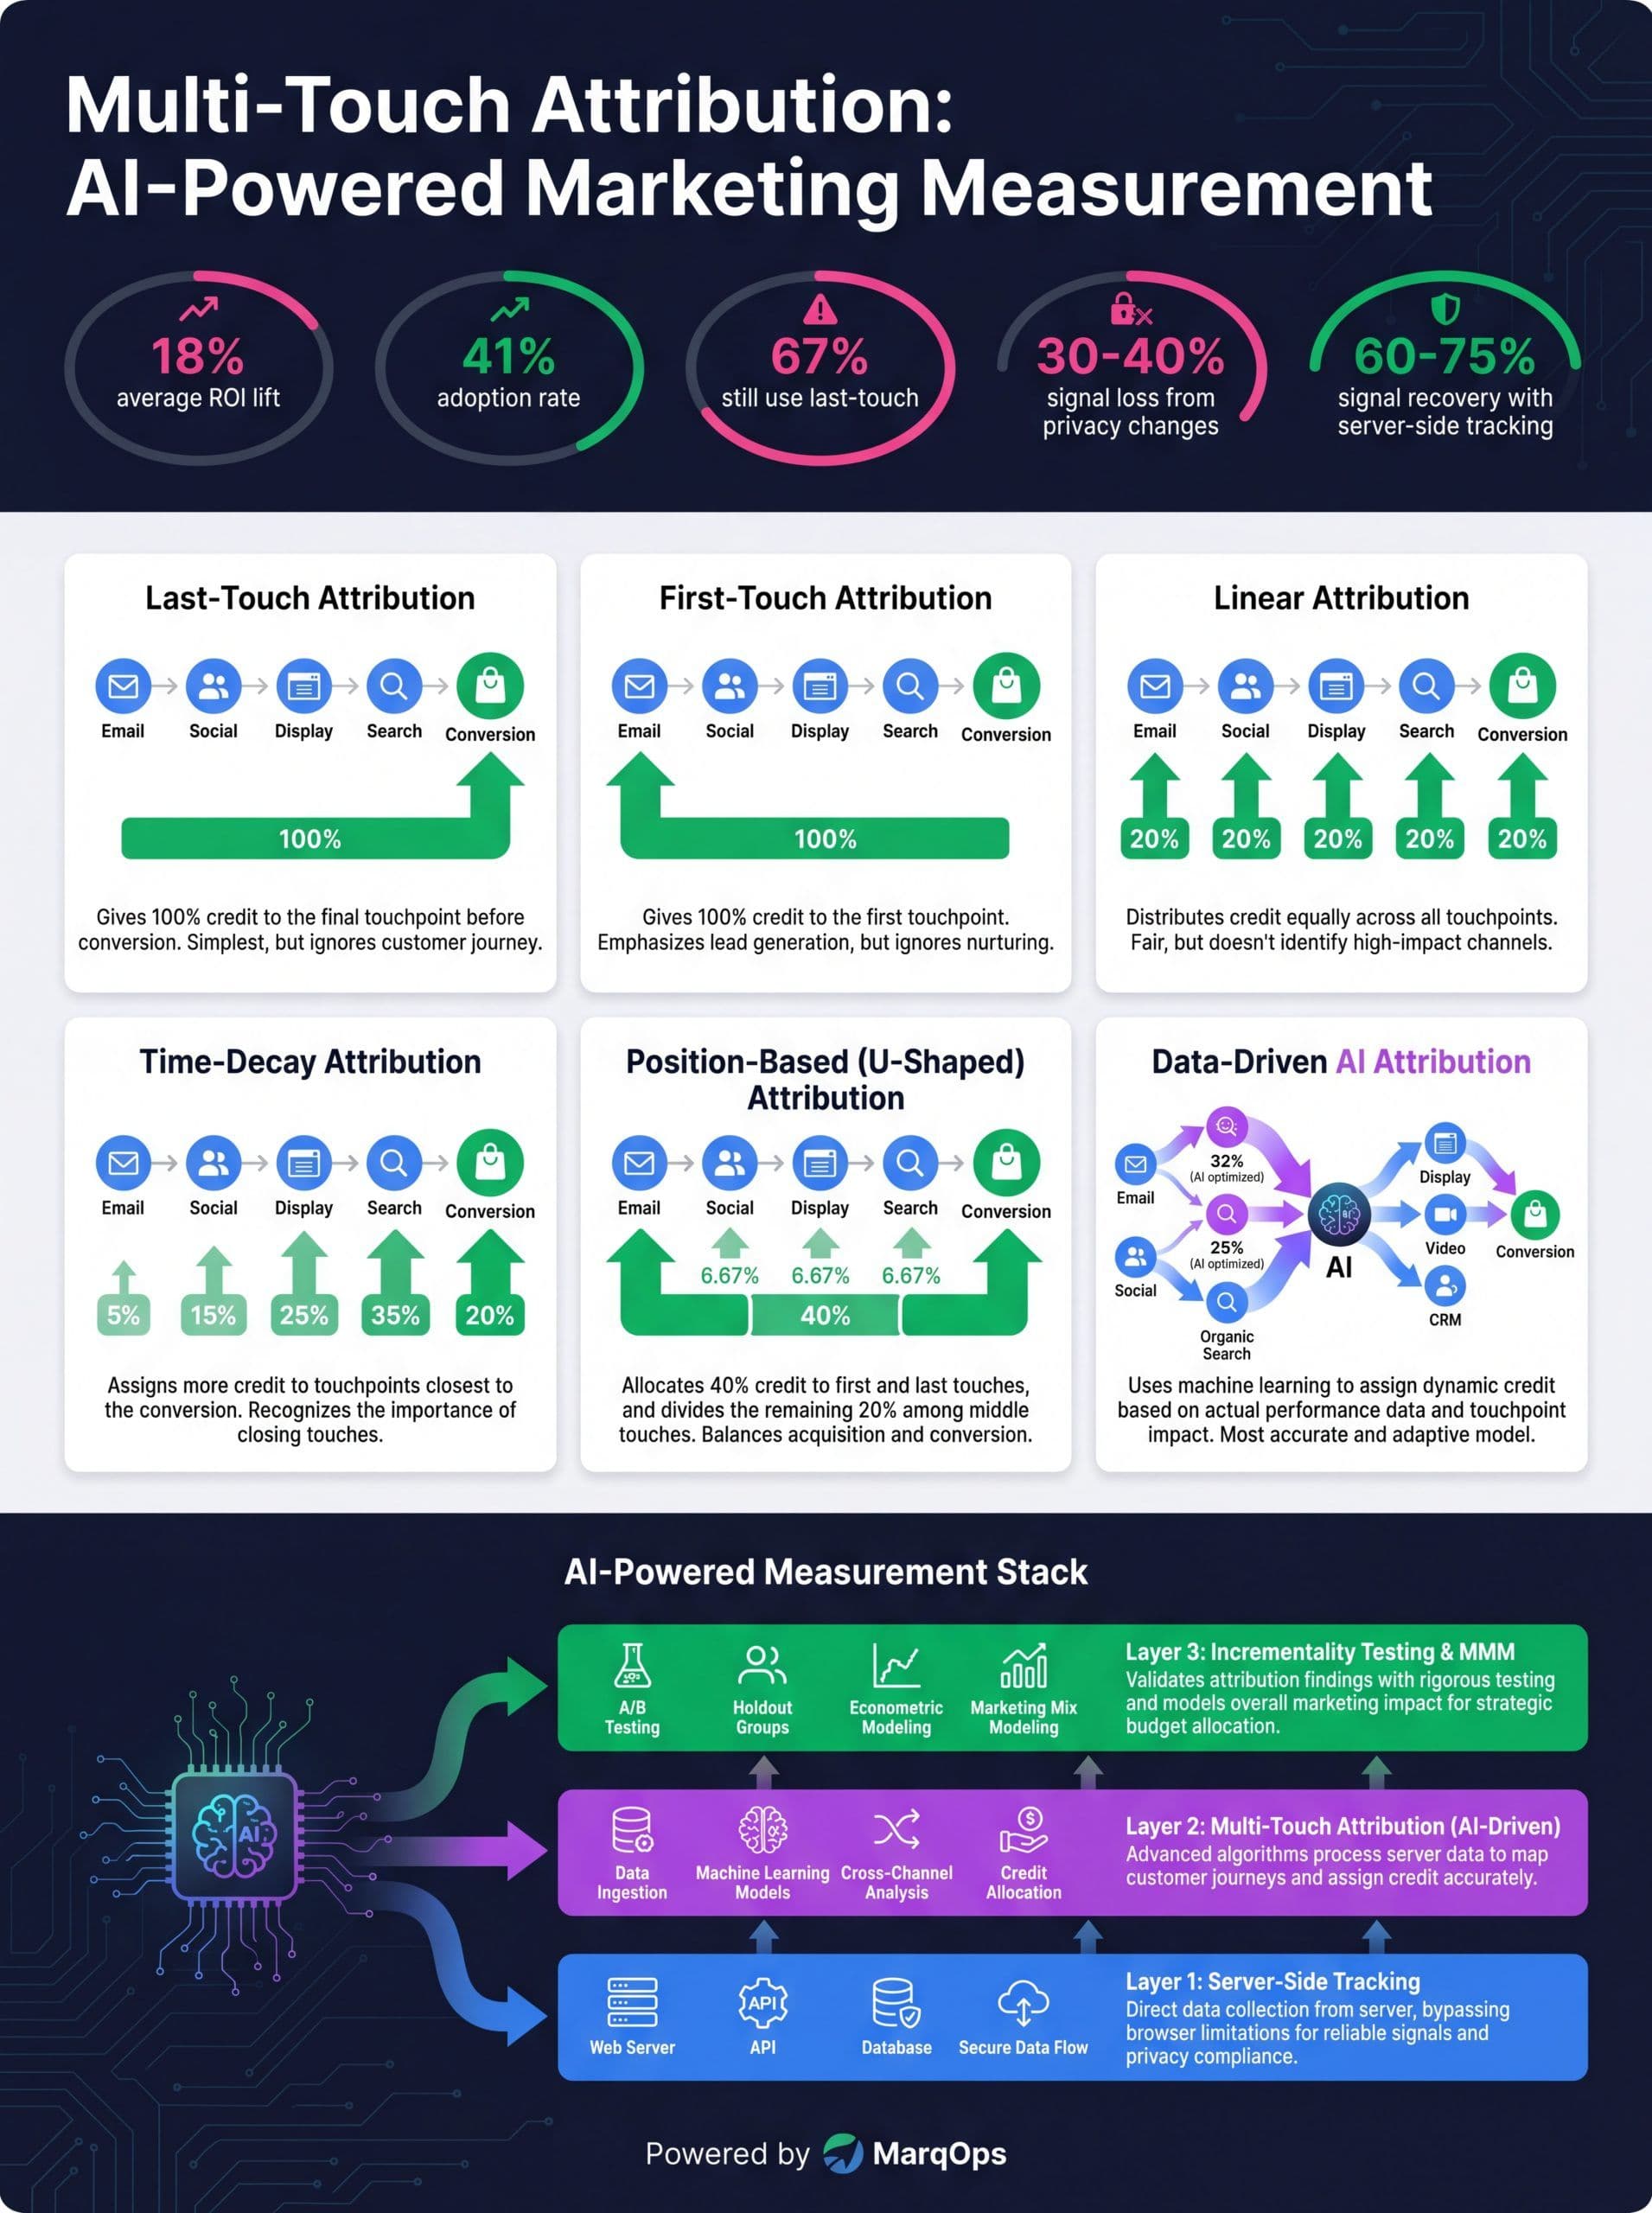
Comparison of attribution models and the AI-powered multi-touch attribution workflow in 2026.
Rule-based attribution models (linear, time-decay, position-based) are just opinions expressed as math. They pick a rule and stick to it, whether or not the rule reflects how your customers actually buy. AI attribution replaces opinion with evidence.
Data-driven attribution uses machine learning to analyze millions of actual conversion paths on your data, identify which sequences of touchpoints reliably precede conversions, and assign credit based on statistical contribution. The same email might be worth 25% of the credit for a high-intent buyer and 2% for a tire kicker, because the model sees the context.
Beyond credit assignment, AI is reshaping the entire attribution pipeline:
- Path clustering: AI groups similar customer journeys into archetypes, so you can see the top 20 patterns instead of drowning in 200,000 unique paths.
- Probabilistic matching: When deterministic IDs fail (blocked cookies, cross-device gaps), ML infers that two sessions probably belong to the same user based on behavioral fingerprints.
- Anomaly detection: Models flag when a channel’s contribution drops or spikes unexpectedly, surfacing optimization opportunities without a human staring at dashboards.
- Continuous retraining: Attribution models go stale fast because the mix changes. AI retrains on the latest data weekly so you are not optimizing against last quarter’s reality.
This is where AI-native platforms pull ahead. MarqOps uses a multi-model AI pipeline that feeds attribution signals into the same system that handles creative production, paid media bidding, and SEO, so insights become actions without a hand-off. Instead of discovering that your Google Ads Performance Max campaign is undervaluing a key audience and filing a ticket, the creative and bidding layers react in the same session. For the paid side of that loop, see our Performance Max AI guide and our breakdown of AI Max Google Ads.
AI also powers adjacent techniques like predictive marketing analytics, which forecasts customer lifetime value and churn on top of historical attribution. Together, attribution tells you what worked and prediction tells you what to do next.
The Post-Cookie Attribution Playbook
If your attribution still depends on third-party cookies and IDFA, you are measuring less than 60% of reality. Here is the three-layer stack that actually works in 2026:
Layer 1: Server-Side Tracking and First-Party Data
Move conversion tracking from the browser to your server. Tools like Google’s Conversion API, Meta’s Conversion API, and enhanced conversions on every major ad platform recover 60 to 75% of the signal lost to ITP, ATT, and cookie blockers. Pair this with a clean first-party data foundation (CRM events, email engagement, product analytics) so you have identifiers the browser cannot take away.
Layer 2: Multi-Touch Attribution on Stitched Data
With server-side data as the source, run multi-touch attribution on the stitched journey. Use data-driven attribution where volume permits, and fall back to position-based or time-decay for low-volume segments. This is where customer journey analytics earns its keep, showing the actual path rather than a collection of disconnected platform reports.
Layer 3: Incrementality Testing and Marketing Mix Modeling
MTA alone cannot tell you whether a channel is genuinely driving incremental revenue or just taking credit for sales that would have happened anyway. Holdout-group incrementality tests (turn a channel off in one geography or audience segment, keep it on in another, measure the delta) cut through attribution noise entirely. Marketing mix modeling adds a top-down view that includes offline spend and brand effects. Open-source tools like Meta’s Meridian, Google’s LightweightMMM, and PyMC-Marketing have democratized what used to require a dedicated data science team.
Playbook rule of thumb: Use MTA to allocate within a channel, incrementality to validate that the channel deserves any budget at all, and MMM to set the top-level channel mix. No single technique is enough on its own.
A 6-Step Implementation Framework
Here is the sequence teams should follow to get multi-touch attribution running in 60 to 90 days, without a six-figure consulting engagement.
Step 1. Define the conversion actions that matter. For B2B that is typically MQL, SQL, opportunity created, and closed-won revenue. For DTC it is first purchase, repeat purchase, and LTV. Attribution is worthless if you attribute credit to the wrong outcome.
Step 2. Inventory every touchpoint source. Ad platforms, email tools, CRM, web analytics, CDP, call tracking, offline events. Each one needs a consistent user identifier (email hash, logged-in ID, deterministic match key).
Step 3. Build a unified event layer. Pipe every touchpoint into a single store (CDP, data warehouse, or unified marketing platform like MarqOps) with a common schema. Without this step, attribution is just guessing.
Step 4. Pick your primary model. Default to data-driven attribution if you have 500+ monthly conversions per conversion type. Otherwise, start with position-based and upgrade when volume allows.
Step 5. Validate with incrementality. Before you trust the model, run a holdout test on a high-spend channel. If attribution credits the channel with driving $1M and the holdout shows $200K of incremental lift, your model is too generous. Recalibrate.
Step 6. Operationalize. Build attribution into weekly budget reviews, creative decisions, and campaign launches. Data that sits in a dashboard nobody opens is wasted effort.
Marketing Attribution Tools and Software in 2026
The marketing attribution tools landscape splits into four categories. Pick based on where you are in the maturity curve.
Native ad platform attribution: Google Ads data-driven attribution, Meta Advantage+, LinkedIn Revenue Attribution. Free, but siloed to the platform’s own inventory. Fine for single-channel reporting, dangerous as a full-funnel view.
Web analytics platforms: Google Analytics 4, Adobe Analytics. Good for web-based conversion paths, weaker for offline and cross-channel stitching.
Specialized marketing attribution software: Branch, AppsFlyer, Adjust (mobile-first), Segment with a CDP partner, Rockerbox, Cometly, Northbeam (DTC-focused). Strong stitching across channels but typically do not include creative production or media activation.
Unified marketing operations platforms: This is the emerging category and where the market is heading. Platforms like MarqOps bring attribution into the same system as creative, SEO, paid media, and analytics. The advantage is that an attribution insight (“our LinkedIn video ads are undercredited for enterprise deals”) becomes a creative brief and a bid adjustment in the same dashboard, instead of a three-week hand-off. One platform replaces 7+ disconnected marketing tools.
If you want a broader view of tool categories across your stack, our roundup of the best AI marketing tools in 2026 is a good next read, along with our guide to AI in marketing automation.
How to Act on Attribution Data
Attribution without action is just expensive reporting. These are the four moves that separate teams who see an 18% ROI lift from teams who generate beautiful dashboards and nothing else.
Reallocate budget weekly, not quarterly. If attribution shows a channel is producing 2x the credit it gets today, shift budget now. Weekly reallocation cycles capture the learning curve; quarterly ones miss it entirely.
Kill the zombies. Every portfolio has channels that keep running on inertia. Multi-touch attribution usually exposes two or three of them getting undeserved credit. Cut them, rerun incrementality, and redeploy.
Feed attribution into creative. Attribution data tells you which messages, formats, and audiences actually convert, not which get clicks. Pipe those insights into creative briefs. Our AI copywriting tool guide walks through how teams now produce 6x faster creative output once they know what the data says to emphasize.
Align sales and marketing on the same definition. 62% of B2B attribution disputes come down to sales and marketing using different conversion definitions. Agree on what counts as an SQL, a stage-2 opportunity, and a closed-won, and build attribution around the same events. Our AI agents for marketing article has more on how cross-functional workflows hold up under automation.
Common Pitfalls to Avoid
Confusing correlation with causation. Multi-touch attribution is a credit assignment exercise, not a proof of causality. A channel that appears in 80% of converting paths may not be causing those conversions. This is why incrementality testing exists.
Ignoring offline touchpoints. If your buyers attend events, see out-of-home ads, or watch connected TV, they leave attribution-invisible fingerprints. MMM fills this gap. Most teams underweight it because it is less immediate than MTA, and then wonder why their models keep overpromising.
Overfitting to short lookback windows. B2B journeys of 60+ days do not fit in a 30-day attribution window. Set lookback windows that match the actual sales cycle.
Treating attribution as a one-time project. Attribution models need to be retrained, recalibrated, and revalidated. The mix changes, buyer behavior shifts, privacy rules tighten. Pick a platform that supports continuous learning rather than a static implementation.
Letting data live in silos. This is the single biggest cause of attribution failure. If ad data, web data, CRM data, and call data each live in their own tool, you are stitching journeys together in spreadsheets. A unified platform eliminates the glue code.
Frequently Asked Questions
What is multi-touch attribution in simple terms?
Multi-touch attribution is the practice of spreading credit for a conversion across every marketing touchpoint that influenced the buyer, not just the last one. Instead of a single channel getting 100% of the credit, each touchpoint gets a fractional share based on how much it contributed to the outcome.
What is the difference between multi-touch attribution and marketing mix modeling?
Multi-touch attribution works at the individual user level, stitching together the exact sequence of touchpoints a person experienced. Marketing mix modeling works at the aggregate level, measuring how changes in channel spend correlate with changes in revenue without needing user-level tracking. Modern teams use both: MTA for digital channels and within-channel optimization, MMM for offline channels and top-level budget allocation.
How do I choose the right marketing attribution model?
If you have 500+ conversions per month per conversion type, use data-driven attribution. If your volume is lower, start with position-based (U-shaped) attribution to credit both the first and last touchpoints meaningfully. Avoid last-touch in 2026 unless you are running a single-channel business with very short sales cycles. Validate whichever model you pick with periodic incrementality tests.
Does multi-touch attribution still work after third-party cookies are gone?
Yes, but the implementation has to change. Server-side tracking, first-party data foundations, probabilistic matching, and conversion APIs recover 60 to 75% of the signal lost to cookie deprecation and iOS ATT. Teams running MTA on legacy pixel-based tracking will see gaps. Teams running MTA on a modern server-side stack see results close to the pre-2021 baseline.
What are the best marketing attribution tools in 2026?
For single-channel analysis, the native attribution in Google Ads, Meta, and LinkedIn is free and improving fast. For multi-channel attribution, dedicated tools like Rockerbox, Northbeam, and Cometly lead the DTC space, while AppsFlyer and Branch lead mobile. For marketing teams that want attribution tied to creative production, SEO, and media activation in one dashboard, unified platforms like MarqOps replace 7+ point tools with a single brand-intelligent system.
Bring It All Together
Multi-touch attribution is no longer optional. The teams hitting their growth numbers in 2026 are the ones who moved past last-touch reporting, rebuilt their measurement stack for a cookieless world, and made attribution a weekly operating cadence rather than a quarterly slide.
The hard part is not the math; it is the plumbing. Stitching data across ad platforms, CRM, analytics, and offline sources is where most attribution projects go to die. That is the problem MarqOps was built to solve. Instead of bolting attribution on top of seven disconnected tools, MarqOps runs multi-touch attribution, customer journey analytics, creative production, SEO, and paid media inside one AI-powered platform, with Brand Intelligence DNA ensuring every output stays on brand. One dashboard replaces 7+ tools, and your team gets 6x faster content output because the loop between insight and action is closed.
If you want to keep exploring, our AI personalization guide pairs naturally with attribution work (both depend on unified customer data), and our AI content strategy guide covers how to turn attribution insights into the kind of content that actually moves pipeline.
Keep following the signal