Marketing Mix Modeling in 2026: The AI-Powered Guide to Measuring True Marketing ROI
A complete 2026 guide to marketing mix modeling: methodology, AI transformation, data requirements, comparison with multi-touch attribution and incrementality testing, top tools (Robyn, Meridian), implementation steps, and how to operationalize insights.
Marketing Mix Modeling in 2026: The AI-Powered Guide to Measuring True Marketing ROI
Last updated: May 2, 2026 | Reading time: 14 minutes
Cookies are gone. Identity resolution is fragmented. Walled gardens have closed off user-level data. And yet, your CMO still wants to know which channels actually drive revenue. That is the 2026 attribution paradox, and the answer most sophisticated marketing teams are landing on is marketing mix modeling (MMM) – now reborn as a real-time, AI-powered system that finally gives you a defensible read on incremental ROI.
According to a July 2025 EMARKETER and TransUnion survey, 46.9% of US marketers plan to increase MMM investment over the next year. The technique that many wrote off as “old school” is now the measurement backbone for privacy-first marketing organizations. This guide walks you through everything you need to deploy modern MMM in your stack – what it is, how AI has transformed it, the data you need, the open-source options, and how to combine MMM with attribution and incrementality testing for a unified measurement program.
TL;DR
- Marketing mix modeling uses statistical analysis on aggregated, historical data to estimate the contribution of each channel to revenue, requiring no cookies or user identifiers.
- AI and machine learning have transformed MMM from a static, quarterly snapshot into a continuous, near real-time decision engine that updates daily.
- You need 2 to 3 years of weekly or daily data covering media spend by channel, sales outcomes, and control variables like seasonality, pricing, and promotions.
- Open-source frameworks like Meta Robyn and Google Meridian have democratized MMM, but require data science skills to operate effectively.
- The strongest 2026 measurement programs combine MMM (strategic budget allocation), multi-touch attribution (tactical optimization), and incrementality testing (causal validation).
- Modern MMM platforms cost $250K to $500K per year for mid-market brands, with payback windows of 2 to 4 months and incremental revenue lift of 10 to 30%.
Table of Contents
- What Is Marketing Mix Modeling?
- Why MMM Is Having a 2026 Renaissance
- How Marketing Mix Modeling Works (The Methodology)
- How AI and Machine Learning Have Transformed MMM
- Data Requirements and Inputs You Need
- MMM vs Multi-Touch Attribution vs Incrementality Testing
- Top Marketing Mix Modeling Tools and Platforms
- Implementation: A Step-by-Step Walkthrough
- Common MMM Mistakes (and How to Avoid Them)
- How MarqOps Operationalizes MMM Insights
- Frequently Asked Questions
What Is Marketing Mix Modeling?
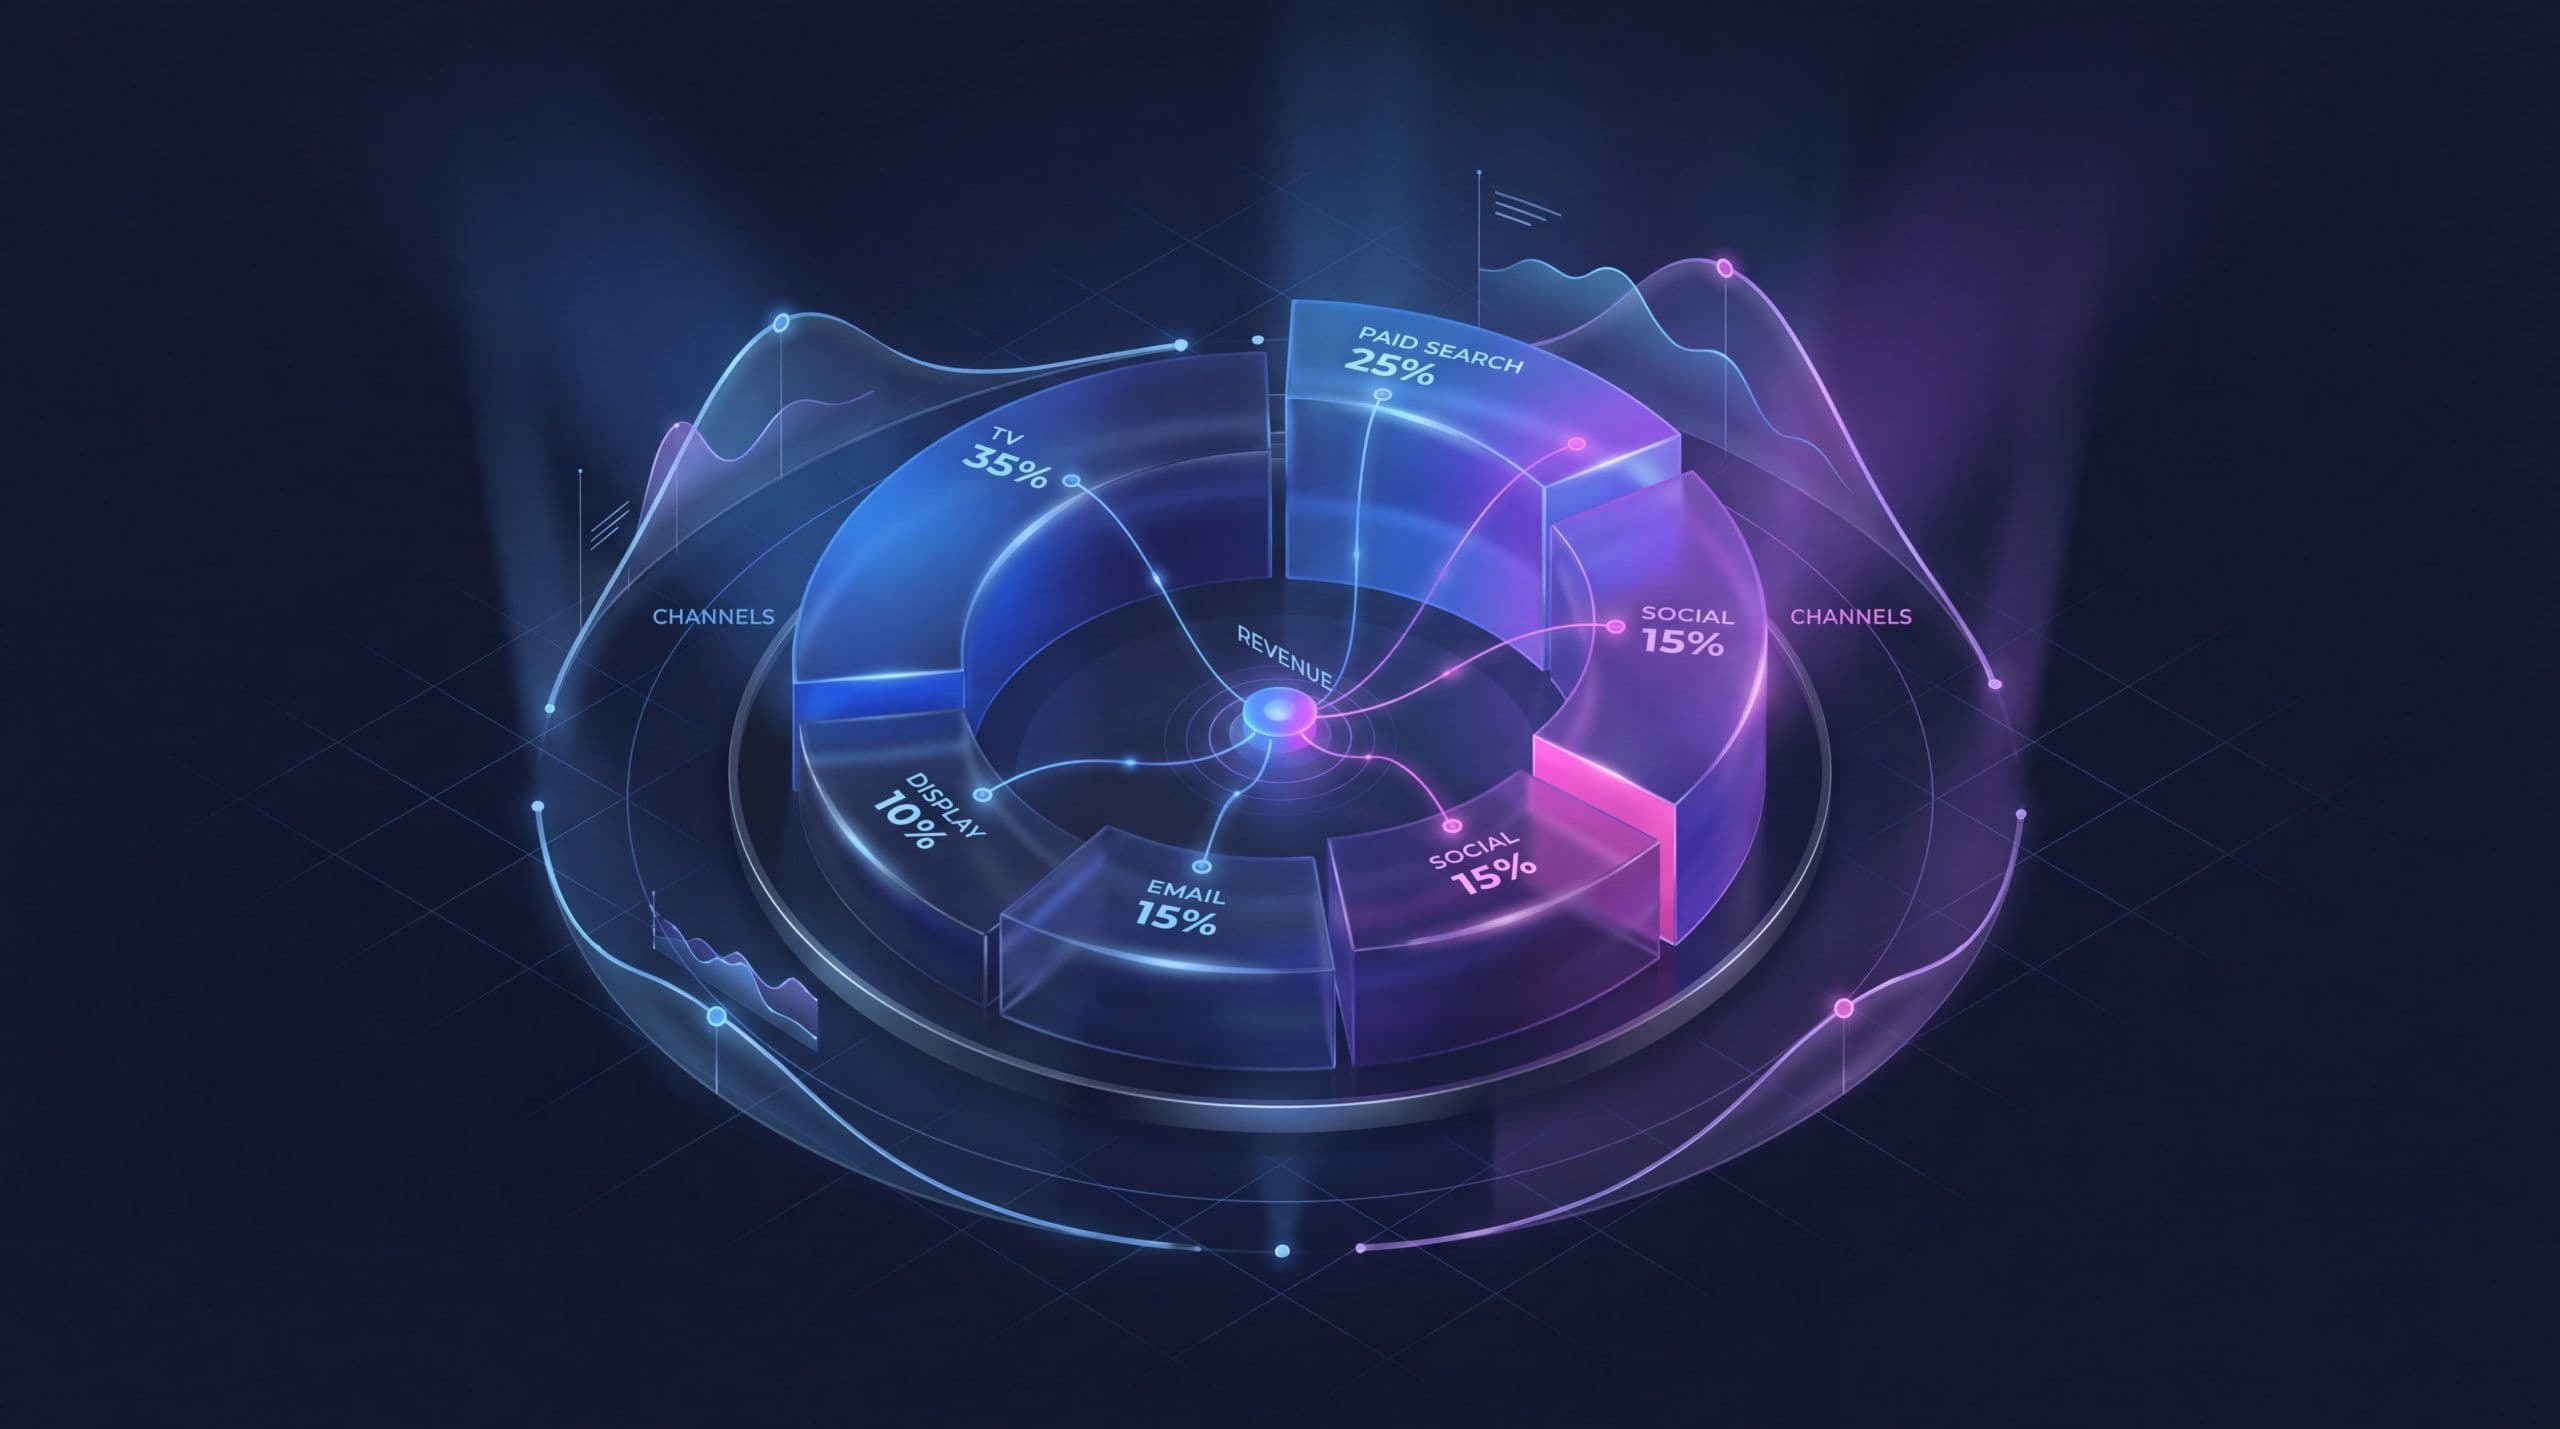
Marketing mix modeling (MMM), sometimes called media mix modeling, is a statistical analysis technique that estimates how much each marketing channel contributes to a business outcome, usually revenue or sales. It works by analyzing aggregated historical data, typically 2 to 3 years of weekly performance, and using regression and machine learning to isolate the impact of each channel while controlling for outside factors like seasonality, pricing, and competition.
Unlike user-level attribution, MMM operates at the macro level. It does not need cookies, device IDs, or individual customer journeys. It looks at the relationship between dollars spent on TV, search, social, email, out-of-home, and offline channels and the sales those dollars produced. The output is a model that says, “For every $1 invested in paid social, you generated $X in incremental revenue, with a saturation point at $Y of monthly spend.”
The MMM definition you need to remember: A top-down, privacy-safe measurement framework that quantifies the incremental impact of every marketing channel on business outcomes by analyzing aggregate spend and outcomes over time.
MMM has been around since the 1960s, originally used by consumer packaged goods (CPG) brands to allocate billion-dollar TV budgets. What changed in 2026 is the methodology – we have moved from quarterly Excel-based regression studies costing $500K and taking six months to AI-driven systems that ingest data daily and recalculate models multiple times per day. That shift is why MMM is back at the center of every CMO’s measurement conversation.
Why MMM Is Having a 2026 Renaissance
Five forces have collided to push MMM from “legacy CPG technique” to “default measurement framework” in 2026:
78%
of marketers say cookieless attribution is a top priority for 2026 (only 32% feel ready)
1. Cookieless tracking forced a methodology reset
Third-party cookies are gone. iOS App Tracking Transparency, GDPR, CCPA, and a wave of state-level privacy laws have shrunk the deterministic data marketers can collect. MTA models that rely on stitching together user-level touchpoints have lost up to 60% of their input signal in the last two years. MMM does not care about identity resolution because it never used it in the first place. That makes it the safest long-term measurement bet.
2. Walled gardens are sharing less
Meta, Google, TikTok, and Amazon increasingly limit what conversion data leaves their platforms. Attribution windows have shrunk. Modeled conversions are increasing. Marketers can no longer trust the numbers they see in each ad platform’s UI. MMM provides an independent, top-down view that reconciles platform-reported numbers with actual incremental business outcomes.
3. AI made MMM fast, cheap, and accessible
Traditional MMM required a PhD econometrician, six months, and a half-million-dollar consulting fee. AI-powered MMM platforms now automate data ingestion, variable selection, model iteration, and optimization. Cycle times have dropped from months to weeks. Costs have come down by 5 to 10x. Interfaces have shifted to chat-based what-if queries that any marketing director can run.
4. CFOs want defensible numbers
In a tighter spending environment, marketing budgets get scrutinized. CFOs do not trust last-click. They do not trust platform-reported ROAS. They want a board-defensible model that ties marketing dollars to revenue with statistical confidence intervals. MMM delivers that. It is the language CFOs already speak.
5. Open-source frameworks democratized the technique
Meta released Robyn in 2020. Google released LightweightMMM in 2022 and its successor Meridian in 2024. Both are free, Bayesian, and battle-tested. A small team with a competent data scientist can now stand up a working MMM in weeks rather than months. The barrier to entry collapsed.
How Marketing Mix Modeling Works (The Methodology)
At its core, MMM is a regression problem. You build a model that predicts sales as a function of marketing inputs and control variables. The simplest form looks like this:
Sales = f(TV_spend, Search_spend, Social_spend, Email_volume, Promotions, Seasonality, Price, Competitor_actions, …) + Base_sales
Modern MMM goes far beyond simple linear regression. Three concepts are essential to understand:
Adstock (carryover effects)
Marketing impact is not instantaneous. A TV impression today drives sales today, next week, and next month. Adstock transformations model this decay. A 50% weekly adstock means half of an ad’s effect persists into the next week, decaying geometrically. Different channels have different decay rates. TV typically has long adstock (4 to 8 weeks), paid search has very short adstock (1 to 2 days).
Saturation (diminishing returns)
Doubling your spend rarely doubles your results. Saturation curves (typically Hill or S-curve transformations) model the point at which additional dollars produce smaller incremental returns. Identifying the saturation point of each channel is one of the most valuable outputs of an MMM. It tells you exactly where to stop spending on a saturated channel and where to redirect that budget.
Bayesian inference
Bayesian MMM (used by Meta Robyn and Google Meridian) starts with prior beliefs about how each channel behaves and updates those beliefs based on observed data. The output is a posterior distribution that quantifies uncertainty. Instead of saying “TV ROI is $3.40,” a Bayesian MMM says “TV ROI is most likely $3.40, with a 90% credible interval of $2.80 to $4.10.” That uncertainty estimate is gold for budget planning.
Pro tip: Hamiltonian Monte Carlo (HMC) and the No-U-Turn Sampler (NUTS) are the modern MCMC algorithms used to fit Bayesian MMMs. They explore parameter space far more efficiently than older Metropolis-Hastings methods, which is why frameworks like PyMC and Stan have become the de facto choice.
How AI and Machine Learning Have Transformed MMM
The shift from classical MMM to AI-driven MMM is not just a speed improvement. It is a methodological leap. Here is what changed:
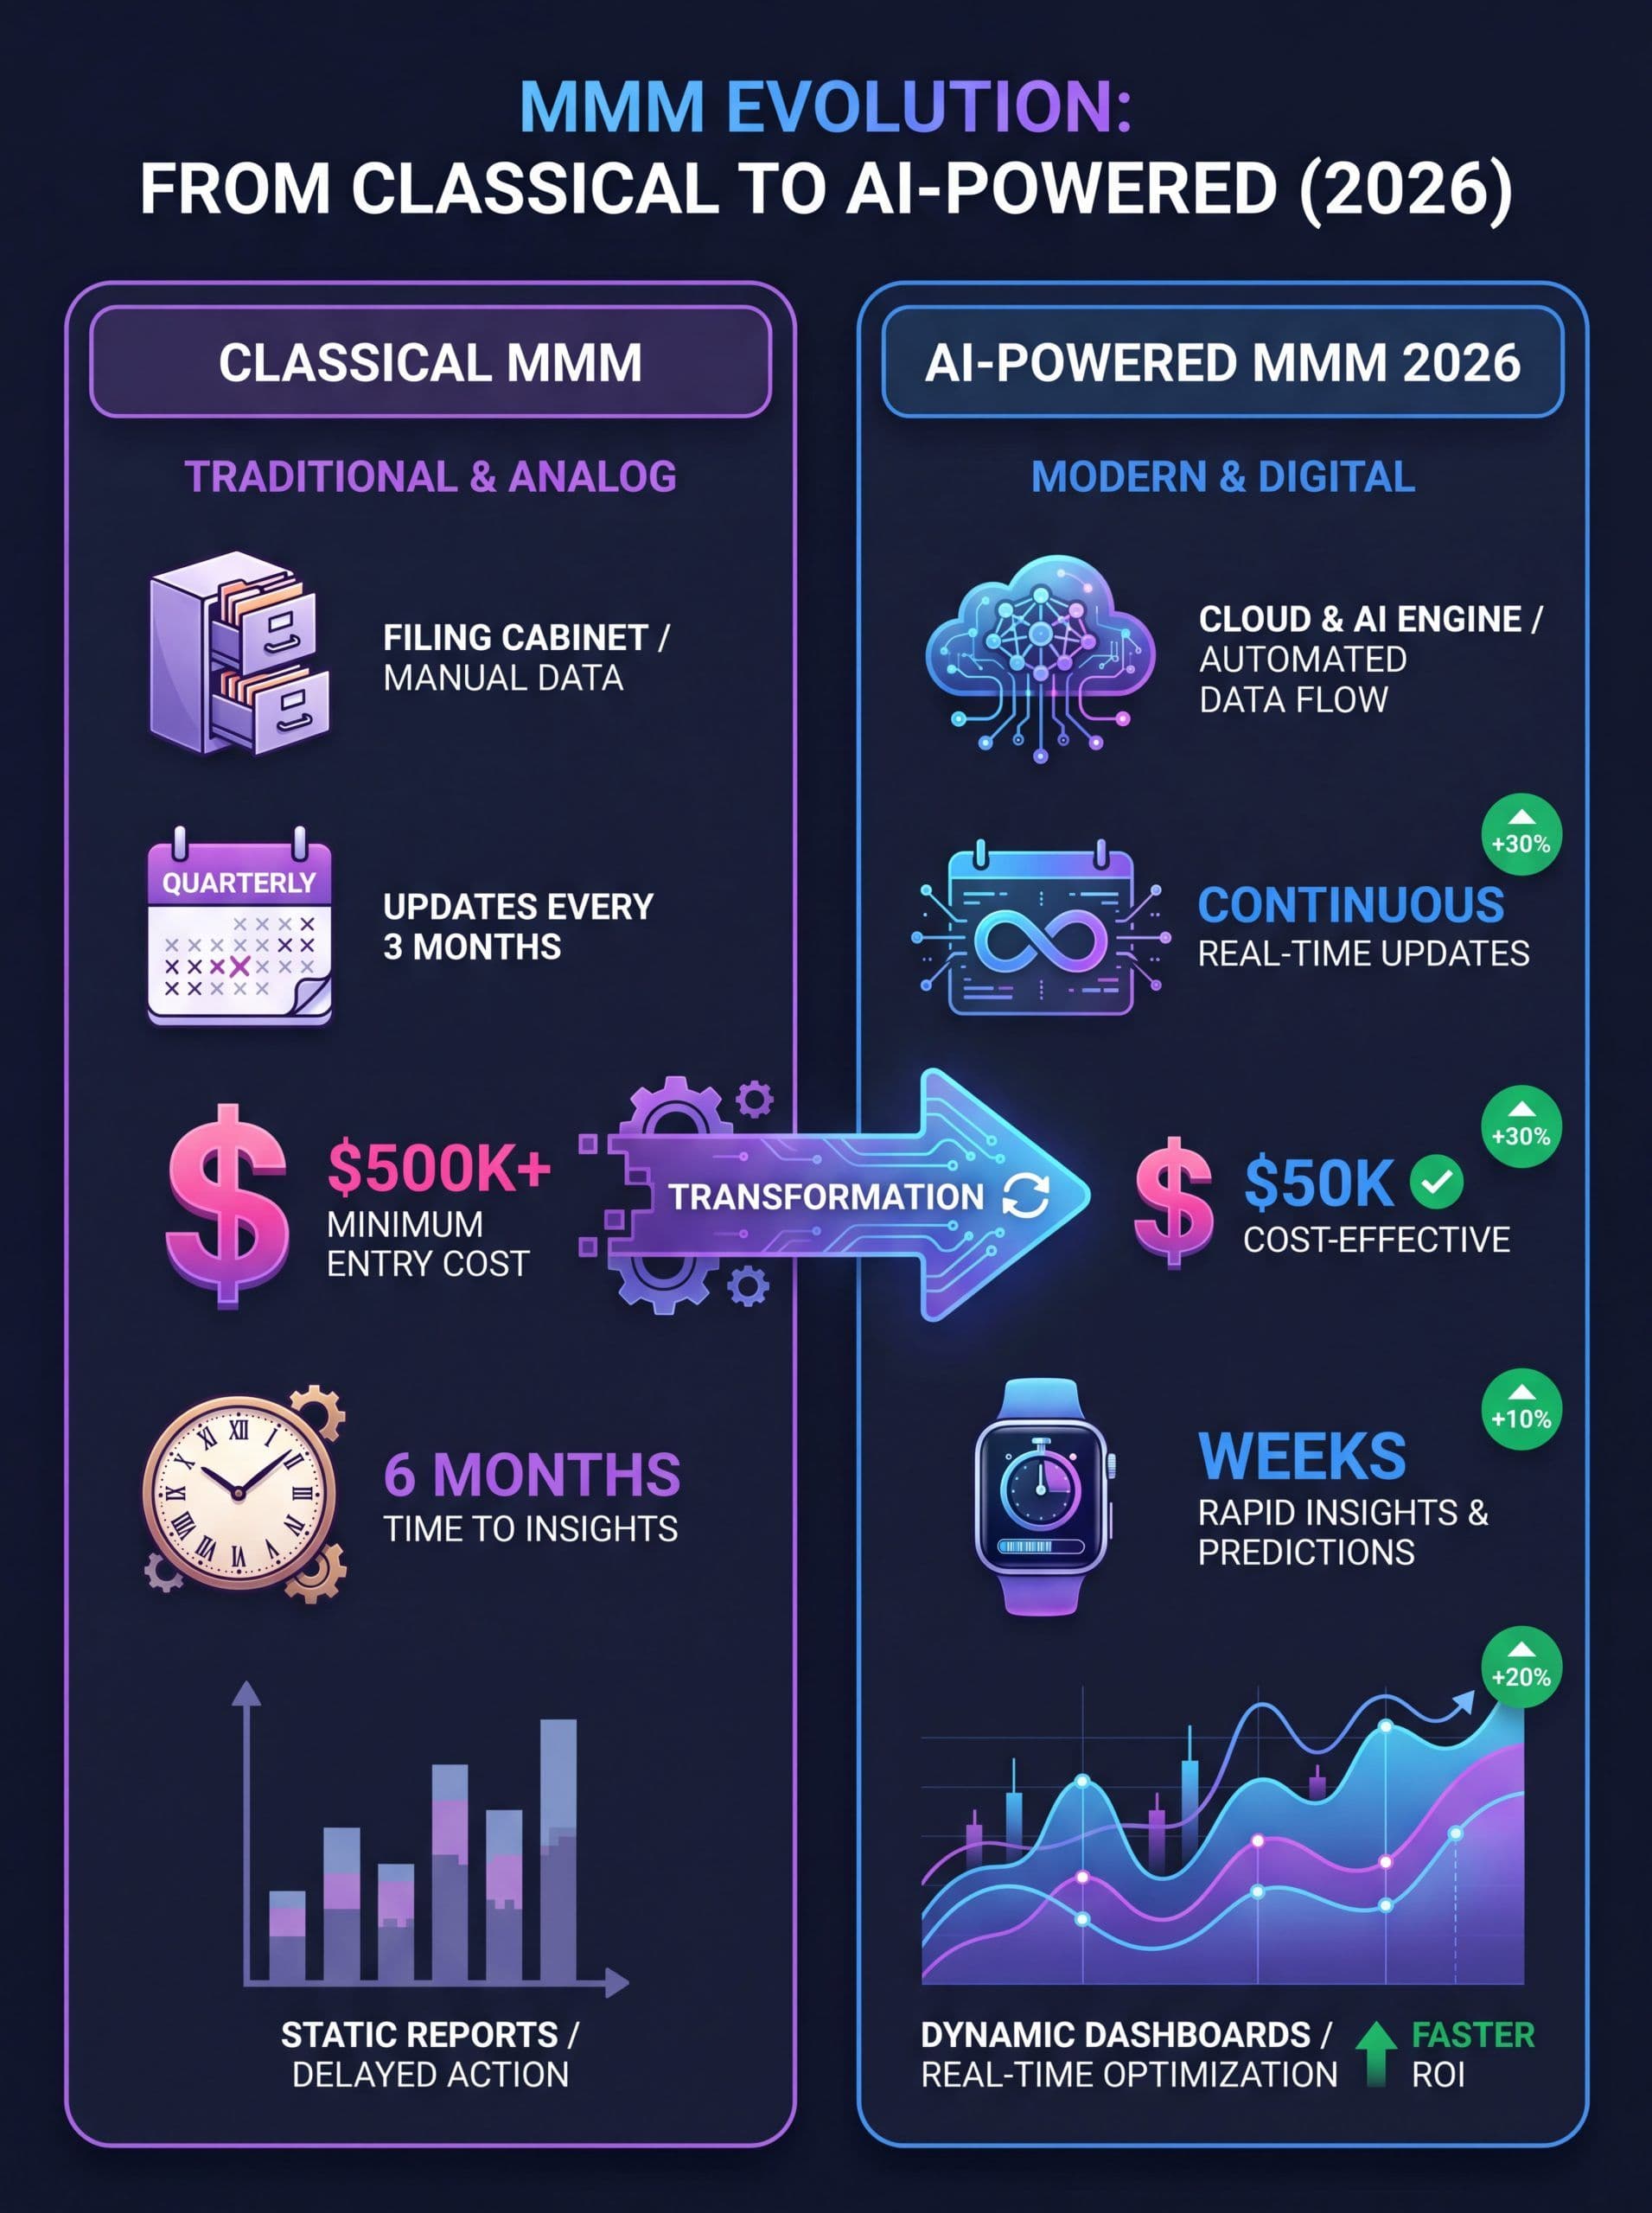
Figure: How AI has transformed marketing mix modeling from a quarterly snapshot to a continuous decision engine.
XGBoost and gradient boosting capture non-linear effects
Modern frameworks use XGBoost and similar gradient boosting algorithms alongside regression to capture non-linear relationships and cross-channel synergies that linear models miss. Combined with SHAP (SHapley Additive Explanations) values, they produce channel-level interpretability that even the most skeptical CFO can defend.
Continuous modeling instead of static snapshots
Legacy MMM produced one model per quarter. AI-driven MMM ingests data hourly and recalculates models multiple times per day. Budget recommendations update as market conditions change. When a competitor cuts paid search spend or a holiday weekend shifts demand, your MMM responds within hours rather than waiting for the next quarterly review.
LLMs translate stats into action
Large language models now sit on top of MMM outputs. Instead of reading regression coefficients, marketing directors ask, “What happens if I shift $200K from display to YouTube next quarter?” The LLM runs the scenario, summarizes the predicted lift in plain English, and flags the assumptions. That dramatically reduces the gap between data scientists and operators.
Automated data preparation
Data prep used to consume 60 to 70% of an MMM project. AI-driven platforms now auto-detect outliers, fill missing values, normalize spend across currencies and channels, and build the feature matrix automatically. What once took 4 weeks now takes 4 hours.
Data Requirements and Inputs You Need
A defensible MMM needs three categories of input data, each at the same time granularity (typically weekly):
| Data Category | What It Includes | Source |
|---|---|---|
| Media spend by channel | Paid search, paid social, display, video, OOH, TV, radio, print, email, affiliate, influencer | Ad platforms, ESP, finance system |
| Outcome variables | Revenue, units sold, qualified leads, signups, app installs (pick 1 primary outcome) | CRM, ecommerce platform, BI warehouse |
| Control variables | Pricing, promotions, distribution, seasonality, holidays, competitor activity, weather, macroeconomic indicators | Internal data + third-party feeds |
How much history do you need?
The rule of thumb is 104 weeks (2 years) minimum, 156 weeks (3 years) ideal. You need enough variance in spend levels and enough seasonal cycles to give the model statistical power. Brands that launched paid social only 6 months ago will struggle to get a stable estimate for that channel. The fix is hierarchical Bayesian models that pool information across similar brands or geographies.
What if you have limited data?
Bayesian methods shine here. By incorporating informative priors from industry benchmarks (TV ROI typically falls in a $1 to $5 range, paid search in $2 to $8, etc.), you can fit a useful MMM with as little as 12 months of data. The model will have wider credible intervals, but it will still produce directionally correct allocation recommendations.
MMM vs Multi-Touch Attribution vs Incrementality Testing
A frequent question we hear at MarqOps is, “If I have MMM, do I still need attribution?” The short answer is yes – the three methodologies answer different questions and the strongest measurement programs use all three together.
| Method | Question Answered | Best For | Decision Cycle |
|---|---|---|---|
| MMM | How should I allocate budget across channels? | Strategic budget planning, offline-heavy mix, long sales cycles | Quarterly to weekly |
| Multi-touch attribution | Which touchpoints drove this conversion? | Tactical optimization, digital-first brands, <7 day sales cycle | Daily |
| Incrementality testing | Did this campaign actually cause the lift? | Validating individual campaigns, reconciling MMM and MTA | Campaign-by-campaign |
A simple rule from leading measurement teams: use MMM when offline channels exceed 30% of spend, sales cycles exceed 30 days, or identity resolution falls below 60%. Use MTA when sales cycles are under 7 days, you need daily optimization, and you track more than 1,000 conversions per month. Use incrementality tests to validate both. We covered this framework in depth in our Multi-Touch Attribution Guide.
The unified measurement stack: MMM provides the cross-channel strategic view. MTA guides daily tactical optimization. Incrementality tests validate whether campaigns drive true lift. When MMM and MTA disagree on a channel’s value, run an incrementality test to break the tie.
Top Marketing Mix Modeling Tools and Platforms
The MMM tooling landscape has split into three tiers: open-source frameworks, mid-market SaaS platforms, and enterprise consulting solutions.
Open-source frameworks (free, requires data scientist)
Meta Robyn – Released by Facebook Marketing Science in 2020. Built on R and Python. Uses Facebook’s Nevergrad optimizer and Prophet for time-series forecasting. Free to use, well-documented, with an active community. Best for teams with at least one R or Python data scientist.
Google Meridian – Successor to LightweightMMM, launched in 2024. Bayesian framework built in Python (TensorFlow Probability). Supports incrementality experimentation alongside modeling. Has become the open-source MMM standard for teams that want a Bayesian approach.
PyMC and Stan – General-purpose Bayesian frameworks. PyMC Labs publishes templates that fit a full MMM with adstock and saturation in under 200 lines of code. Maximum flexibility, maximum data science requirement.
Mid-market SaaS platforms ($50K to $500K/year)
Recast, Mutinex, Northbeam, Measured, OS Data, Sellforte, Funnel – These platforms wrap an MMM engine in a SaaS interface. They handle data ingestion, model fitting, and dashboards. Most include scenario planning (“if I shift $X from search to social, what happens?”) and weekly model refreshes. Best for marketing teams that want MMM without hiring a data scientist.
Enterprise consulting ($500K+/year)
Nielsen, Analytic Partners, Ipsos MMA, Marketing Evolution – Full-service measurement consultancies. Custom modeling, dedicated teams, and integration with offline data sources like point-of-sale and panel data. Best for Fortune 500 brands with $100M+ ad budgets.
Selection guidance: If your annual ad budget is under $5M, start with Robyn or Meridian. $5M to $50M, evaluate mid-market SaaS platforms. Above $50M, consider enterprise consulting alongside an internal data science team. The right answer is rarely “one or the other” – many teams use open-source for tactical exploration and a vendor for the audited quarterly model.
Implementation: A Step-by-Step Walkthrough
Whether you build with open-source or buy a platform, the implementation flow looks roughly the same. Here is the 8-step playbook MarqOps recommends:
Step 1: Define your KPI and timeframe
Pick one primary outcome variable. Most teams choose net revenue, but qualified leads, signups, or app installs work too. Pick one time grain (weekly is the most common) and a 2 to 3 year window.
Step 2: Inventory your channels
List every paid and owned media channel with at least 5% of spend. Combine very small channels into an “other” bucket. Aim for 6 to 12 modeled channels – too many and the model overfits, too few and you lose granularity.
Step 3: Build the data pipeline
Connect ad platforms (Google, Meta, TikTok, LinkedIn), ESP (HubSpot, Marketo, Klaviyo), CRM (Salesforce), and finance systems. Normalize spend to a single currency and time zone. Pull external control data: holidays, weather, macroeconomic indicators. A unified marketing intelligence platform simplifies this dramatically.
Step 4: Specify priors (Bayesian) or constraints
For a Bayesian model, set informed priors. For example, paid search ROI is unlikely to be negative, and TV adstock is usually 4 to 8 weeks. Industry benchmarks fill in the gaps where your data is thin.
Step 5: Fit the model and run diagnostics
Run the regression or Bayesian inference (NUTS/HMC for Bayesian). Check convergence diagnostics: R-hat values close to 1.0, effective sample size above 1,000, no divergent transitions. Validate fit with hold-out periods – if predictions diverge from actuals on a 4-week hold-out, retrain.
Step 6: Interpret channel contributions and saturation curves
Look at base sales (the revenue that would happen with zero marketing) versus incremental sales by channel. Check the saturation curve for each channel. Channels above the saturation point are wasting budget; channels below are underspent.
Step 7: Run scenario optimization
Use the model to answer specific budget questions. “If I have $2M next quarter, where should it go?” Modern platforms let you run 50+ scenarios in minutes and rank them by expected revenue lift.
Step 8: Operationalize the recommendations
A model is only as good as the budget shifts it triggers. Set up a weekly review cadence. Connect MMM outputs to your marketing dashboard so allocation recommendations show up next to actuals. Validate with periodic incrementality tests.
Common MMM Mistakes (and How to Avoid Them)
After working with hundreds of marketing teams running MMM, the same mistakes keep showing up. Here are the most damaging:
1. Treating MMM as a one-time project. A model from 6 months ago is already stale. Markets change, channels evolve, and customer behavior shifts. Refresh your model at least quarterly, ideally weekly.
2. Skipping control variables. Forgetting to include pricing, distribution, or competitor activity inflates the apparent ROI of marketing channels. The model attributes lift to media that was actually driven by a price cut.
3. Pooling brands or regions that behave differently. If you sell in 12 countries, do not run one model. Run a hierarchical model that lets each country have its own coefficients while pooling information.
4. Using ROI without uncertainty. Saying “TV ROI is $3.40” hides the fact that the credible interval might be $1.20 to $5.60. Always present results with confidence intervals so leadership understands the model’s uncertainty.
5. Ignoring saturation. “Spend more on the highest-ROI channel” is wrong if that channel is already saturated. Saturation curves are the most actionable output of an MMM, yet teams often miss them.
6. Not validating against incrementality tests. If your MMM says paid social ROI is $4 but a geo-holdout test says it is $1.50, something is wrong. Use lift tests as ground truth and recalibrate priors.
How MarqOps Operationalizes MMM Insights
A great MMM is wasted if it sits in a quarterly PDF nobody reads. The next step is operationalizing the insights – making sure the budget allocation, creative, and channel decisions actually shift in response to what the model says.
MarqOps connects the dots between measurement and execution. Our unified platform replaces 7+ disconnected marketing tools (analytics, ads, SEO, creative, content, attribution, dashboards) with one Brand Intelligence DNA that understands your goals, your channels, and your output expectations. When your MMM says “shift $50K from display to YouTube,” MarqOps lets you reallocate, generate brand-perfect creative for the new channel, and track the impact in one workflow.
A few specific ways MarqOps closes the MMM-to-execution gap:
Unified data layer. MMM lives or dies on data quality. MarqOps automatically ingests spend and outcome data from every connected channel into one normalized warehouse, so you do not spend 60% of your modeling time on data prep.
Real-time dashboards. Plug your MMM model output into a live marketing dashboard alongside actual performance, so you see in real time when actuals diverge from model predictions.
AI-powered creative production. When MMM tells you to shift budget into a new channel, you need brand-perfect creative for that channel within hours, not weeks. MarqOps generates 6x faster creative output that respects your brand DNA.
Closed-loop attribution. Combining MMM, MTA, and incrementality requires a measurement orchestrator. MarqOps reconciles signals from all three and surfaces conflicts before they become budget mistakes.
Frequently Asked Questions
What is the difference between marketing mix modeling and media mix modeling?
The terms are used almost interchangeably in 2026. Strictly, marketing mix modeling includes non-media variables like pricing, distribution, and product launches. Media mix modeling focuses specifically on paid media channels. Most modern platforms support both scopes, and the choice depends on which levers your team controls.
How long does an MMM project take?
Traditional consulting MMM took 3 to 6 months. AI-driven platforms have compressed that to 2 to 6 weeks for an initial model, with weekly refreshes after launch. Open-source frameworks like Robyn or Meridian can produce a working model in days if your data is clean.
How much does marketing mix modeling cost in 2026?
Open-source tools (Robyn, Meridian) are free, but require a data scientist (typically $120K to $200K loaded cost). Mid-market SaaS platforms range from $50K to $500K per year. Enterprise consulting starts around $500K and can exceed $2M for global brands. Most mid-market deployments deliver payback in 2 to 4 months from improved budget allocation.
Do I need historical data to start MMM?
Ideally 2 to 3 years of weekly data. With less, you can still fit a Bayesian MMM using informed priors and industry benchmarks, but credible intervals will be wider. Below 12 months of data, MMM is generally not the right tool – lean on incrementality testing and platform-level attribution until you accumulate history.
Can MMM measure brand campaigns and PR?
Yes, and this is one of the biggest advantages of MMM over MTA. Brand awareness, PR mentions, sponsorships, and out-of-home all contribute to revenue but rarely produce trackable clicks. MMM captures their incremental impact through correlations between exposure (GRPs, mentions, impressions) and downstream outcomes.
Is MMM still relevant if I’m 100% digital?
Yes. Even pure digital brands face cookie loss, walled-garden opacity, and modeled conversions that distort platform-reported ROAS. MMM provides an independent, top-down measurement that reconciles these signals. Many DTC brands run MMM alongside MTA precisely to validate platform numbers.
What’s the difference between Robyn and Meridian?
Robyn (Meta) uses ridge regression with Nevergrad multi-objective optimization. Meridian (Google) uses Bayesian inference via TensorFlow Probability. Robyn is faster for hyperparameter tuning; Meridian gives you proper uncertainty quantification and supports incrementality experimentation. Many teams use both – Robyn for fast exploration, Meridian for the audited final model.
How do I know if my MMM is accurate?
Three checks: (1) hold-out validation – if the model predicts a 4-week future window within 5 to 10% of actuals, the fit is good; (2) face validity – do the channel contributions match what you observe in lift tests and intuition? (3) incrementality testing – run periodic geo-holdouts and compare measured lift against model-predicted lift. If they disagree by more than 30%, recalibrate.
Final Word: MMM Is Your 2026 Measurement Foundation
Marketing mix modeling is no longer the slow, expensive technique your CMO ignored five years ago. It is the privacy-safe, AI-powered, real-time measurement framework that gives you a defensible answer to the question every CFO is asking: which channels actually drive revenue?
If you are still running marketing decisions on last-click attribution and platform-reported ROAS, you are flying blind in a cookieless world. The teams that win in 2026 will be the ones that combine MMM, attribution, and incrementality into a unified measurement program – and the ones that operationalize the insights inside a unified marketing tech stack that lets them act on what the model says.
Start with the basics. Inventory your channels. Pull 24 months of weekly data. Pick a tool (open-source if you have a data scientist, SaaS if you do not). Run the model. Interpret the saturation curves. Reallocate based on the highest-marginal-ROI channels. Validate with a geo-holdout test. Refresh quarterly.
For more on the broader measurement and ops landscape, explore our guides on predictive marketing analytics, multi-touch attribution, marketing operations, AI marketing strategy, and marketing intelligence platforms.