Google Ads Quality Score: What the 1 to 10 Number Actually Tells You in 2026
Google says the visible Quality Score is a diagnostic and not an auction input, yet the CPC gap between a 10 and a 5 is real. What the three components mean, why broad match scores look broken, how to weight the number correctly, and a 45 minute triage.
Contents
- What Quality Score actually is, and what Google says it is not
- The three components, ranked by how much control you have
- What Quality Score is worth in money
- Why your Quality Score looks broken in an automated account
- Reading the number without lying to yourself
- A 45 minute Quality Score triage
- Landing page experience is the component that moved in 2026
- When Quality Score and performance disagree
- How to put Quality Score in a client report without overclaiming
- Where MarqOps fits
- Frequently asked questions
- The bottom line
What Quality Score actually is, and what Google says it is not
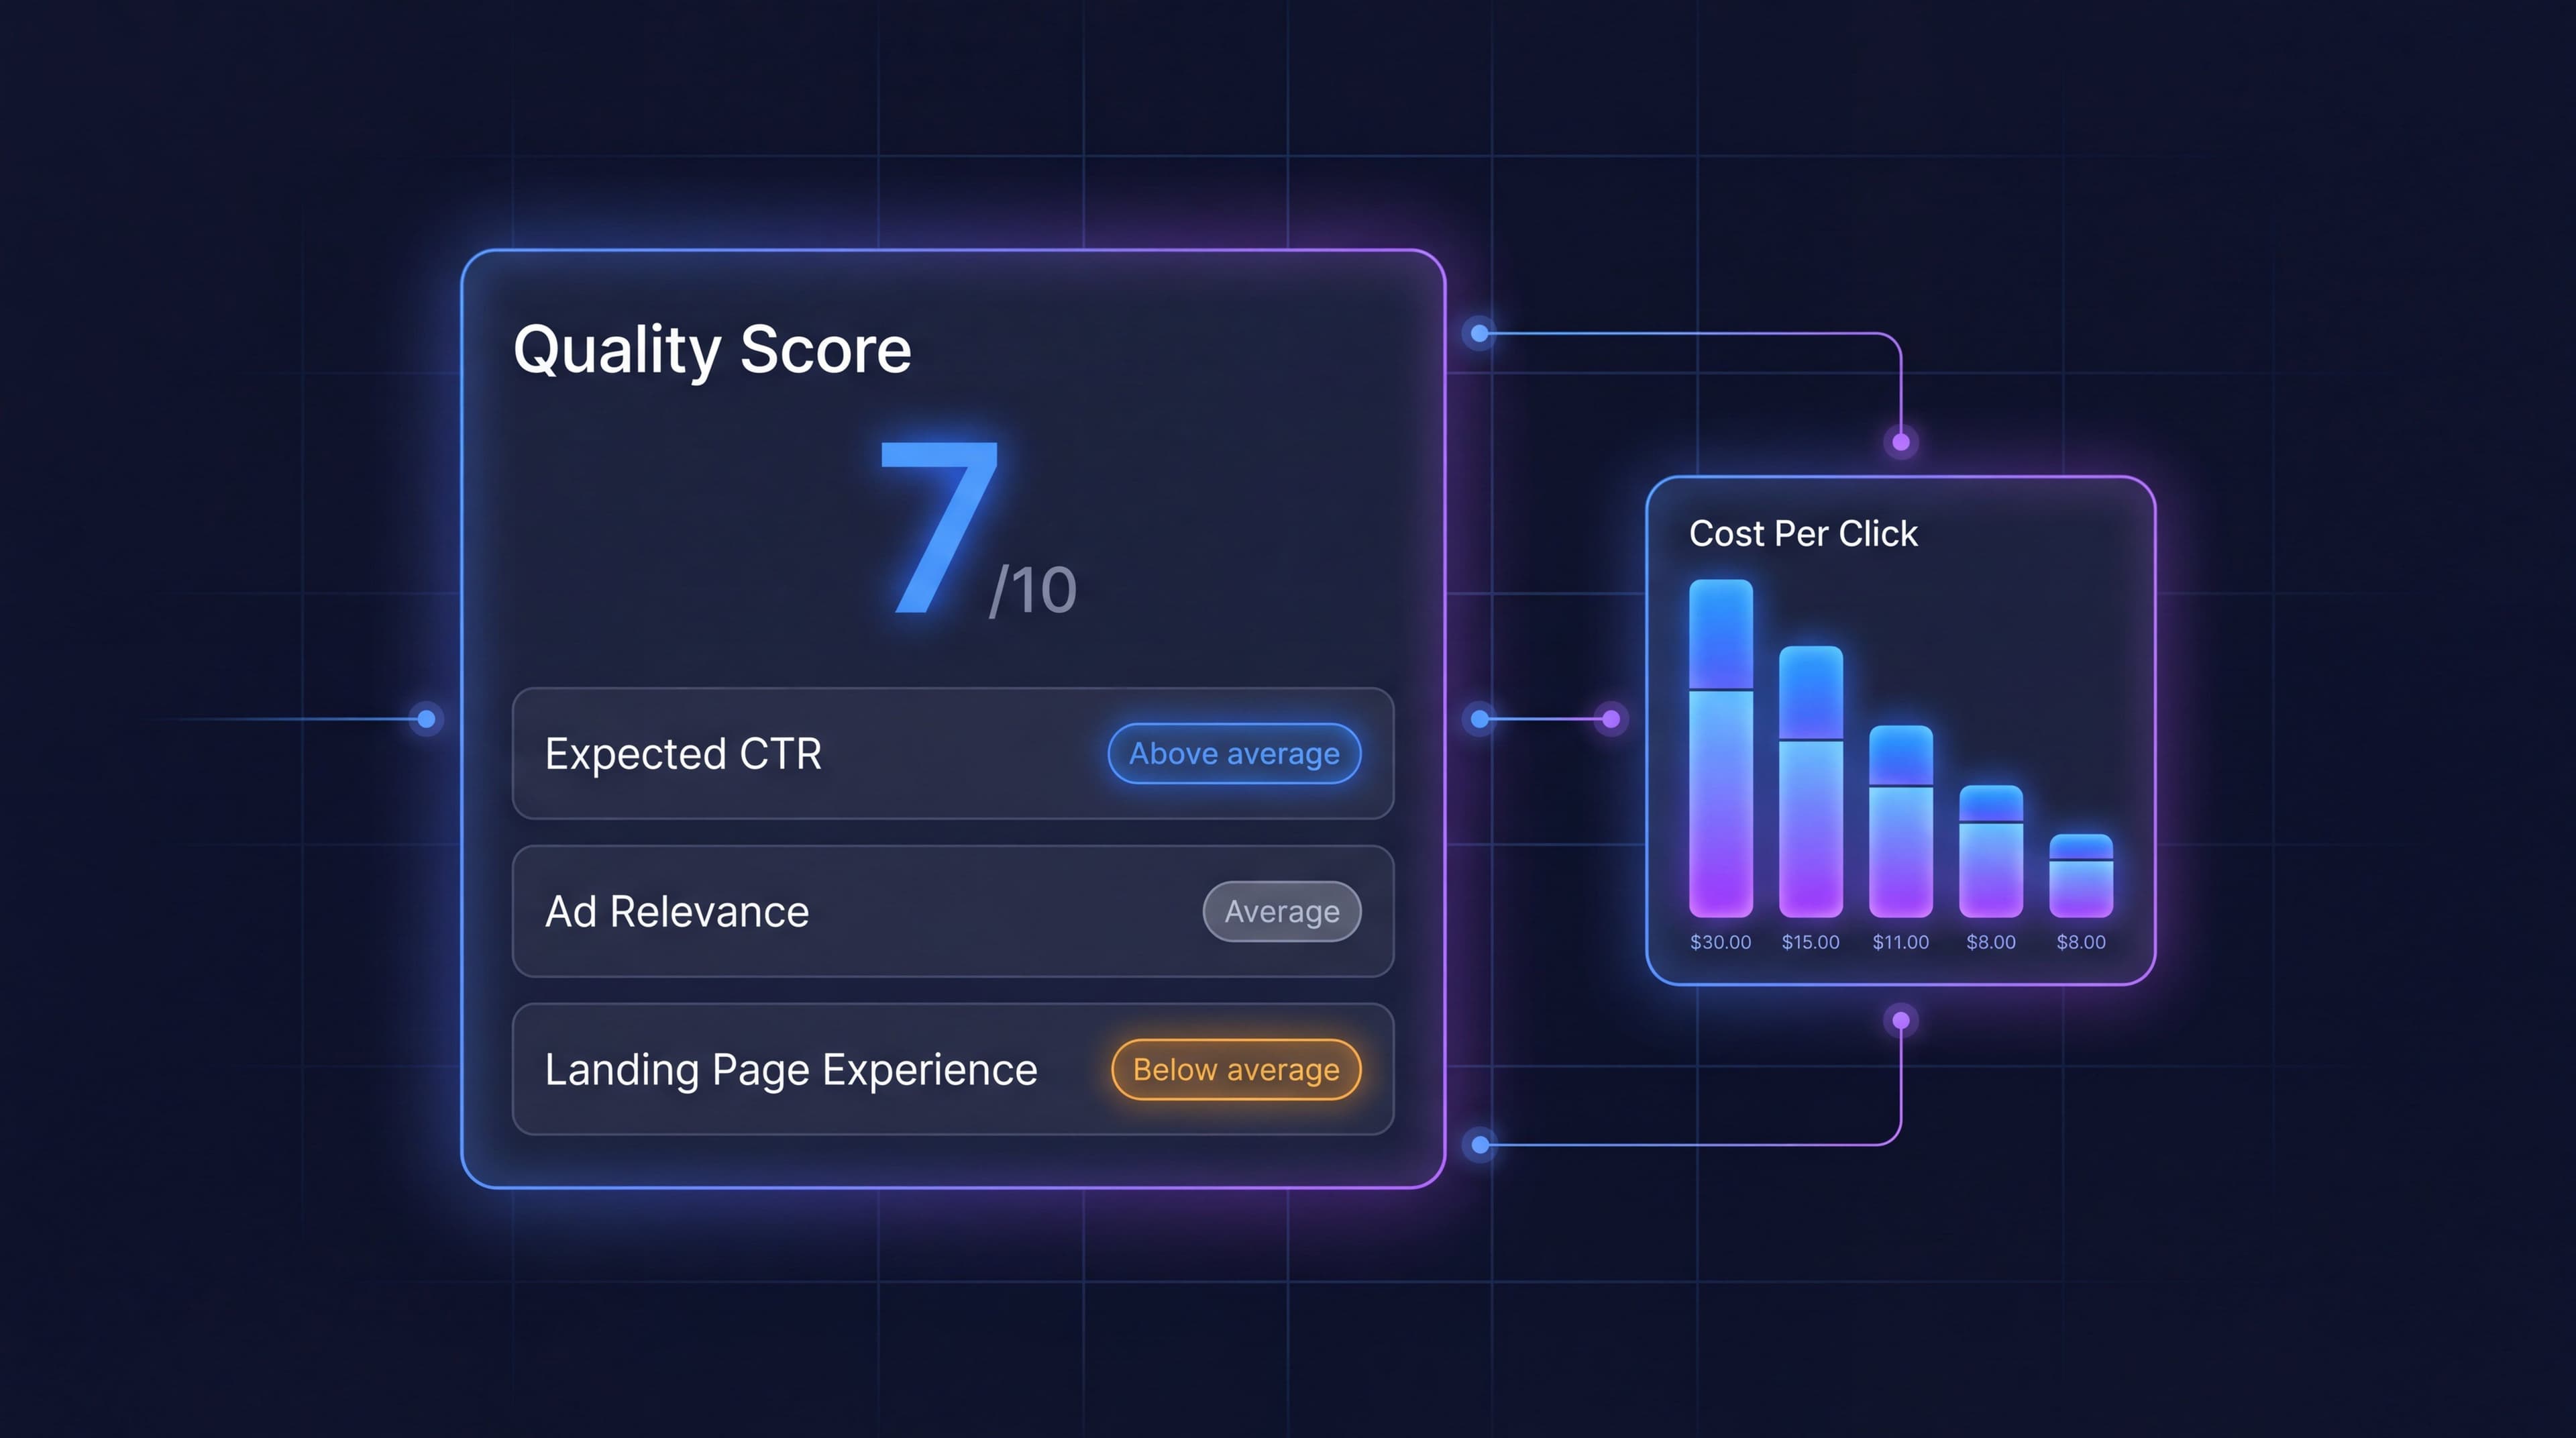
Quality Score is a 1 to 10 estimate Google reports at the keyword level, built from three sub-ratings: expected click-through rate, ad relevance, and landing page experience. Each sub-rating is reported as Below average, Average, or Above average rather than as a number.
Here is the part that most accounts still manage around incorrectly. Google's own documentation states that Quality Score is not used in the ad auction. It is a diagnostic that summarizes how your ads have historically related to user experience for a given keyword. The auction runs on Ad Rank, and Ad Rank is recalculated in real time using live estimates of the same three signals plus your bid, ad formats, context, and the auction-time thresholds Google applies.
So the components matter enormously and the stored number is a rear-view mirror. Both things are true, and holding both at once is what separates a useful Quality Score review from a vanity exercise.
This is also why Quality Score belongs in the diagnostic half of a Google Ads audit rather than in the results summary. It points at the problem. It is not the problem, and it is definitely not the outcome.
The three components, ranked by how much control you have
Google does not publish exact weightings, and the practitioner consensus that landing page experience carries slightly more weight than ad relevance should be treated as an informed estimate rather than a documented fact. What is documented is what each component measures.
| Component | What it measures | How fast you can move it | Biggest lever |
|---|---|---|---|
| Expected CTR | Likelihood the ad is clicked when shown for that keyword, normalized for position | Slowest, needs impression volume to re-learn | Ad copy that names the query back to the searcher |
| Ad relevance | How closely the ad matches the intent behind the keyword | Fastest, often within days | Tighter keyword to ad group mapping |
| Landing page experience | Usefulness, relevance, transparency and navigability of the destination | Slow, but the change is durable | Ad-to-page message match and speed |
Ad relevance is where a review should start, purely on effort economics. It is the component that responds fastest, it is fully inside your control, and a Below average rating there is usually a structural problem rather than a copywriting one. If one ad group contains fourteen loosely related keywords, no headline can be relevant to all of them.
Expected CTR is the trap. It is normalized for ad position, which means you cannot fix it by bidding your way to the top. It also needs volume to recover, so a keyword that has been sitting at Below average for eight months will not recalculate the week after you rewrite the ad.
Landing page experience is the slowest and the most transferable. Work you do there improves organic performance, paid performance, and conversion rate at the same time, which is not true of the other two.
What Quality Score is worth in money
The financial argument for caring about quality signals is well documented, though the precise figures come from vendor and agency analyses rather than from Google, so treat them as directional.
| Quality Score | Reported CPC vs a 5/10 baseline | Practical read |
|---|---|---|
| 10 | About 50% lower | Rare, and rarely worth engineering toward |
| 9 | About 44% lower | Strong, usually branded or tightly themed |
| 8 | About 33% lower | The realistic target for core converting terms |
| 7 | About 25% lower | Already ahead of the reported account average |
| 6 | About 17% lower | Fine. Leave it alone and go fix a 3 |
| 5 | Baseline | The commonly cited median across large account samples |
| 4 | About 12% higher | Worth a look if spend is meaningful |
| 1 | About 200% higher | Open this one first |
Two numbers from that table are worth sitting with. First, the average Quality Score across a frequently cited sample of 15,666 accounts is 5 to 6, so a 7 is already an above-market position. Second, agency analysis of B2B SaaS accounts found a two-point lift from 6 to 8 reduced account-level CPC by 22% to 35%, described as the single largest CPC efficiency lever available in those accounts.
There is a separate finding worth pairing with those: ads rated Above average on both landing page experience and ad relevance were reported to run CPCs around 36% below average, with higher click-through and conversion rates alongside. That is the more useful framing, because it points at the two components you can actually work on rather than at the composite score.
The efficiency only shows up as profit if the conversion side of the account is measuring correctly. A CPC improvement on top of broken measurement just gets you cheaper noise, which is why conversion tracking is the prerequisite rather than the follow-up.
Why your Quality Score looks broken in an automated account
This is the most common 2026 complaint, and it is not a bug in your account. The score is an aggregated estimate built largely on past exact match performance. Automated matching has expanded intent coverage well past tightly defined keyword variants, so the data the score is built from no longer describes the traffic the campaign actually serves.
The symptoms are consistent. Quality Score looks reasonable on phrase and exact match. Broad match terms sit at 2 or 3 even when the landing page is tightly aligned to the theme. Obviously relevant keywords get flagged as rarely shown due to low Quality Score. Meanwhile the account is hitting its ROAS target.
Automation cuts the other way too. A nine month study of 23 AI Max tests across 16 mature advertisers reported that text customization lifted weighted Quality Score from 6.8 to 7.3, with ad relevance showing the largest gain, and that enabling all three AI Max features together produced roughly 40% higher success rates than search term matching alone. The same analysis was blunt about the limits: AI Max finds more traffic, it does not repair weak demand, messy tracking, or poor landing pages.
Campaign types without keyword-level reporting change the question entirely. In Performance Max there is no keyword Quality Score to read, so quality control moves to asset strength, audience signals, exclusions, and the search terms surface you do get. If most of your budget lives there, read our comparison of Performance Max versus Search campaigns and the AI Max guide before you spend a morning on a keyword report that covers a shrinking slice of spend.
Reading the number without lying to yourself
A plain average of Quality Score across an account is close to meaningless. One keyword with a score of 1 and a single impression counts exactly as much as a keyword with a score of 10 and 10,000 impressions, giving you a misleading 5.5 for an account that is actually performing well.
The fix is impression weighting, and it is one formula:
A cost-weighted version is arguably more honest again, because it tells you where the money is exposed rather than where the eyeballs are. Run both. Where impression weighting and cost weighting disagree, you have found an ad group that is expensive relative to its visibility, which is usually the fastest thing in the account to fix.
Whichever weighting you use, write down which one it is. A Quality Score figure with no stated method is not reportable, for the same reason a ranking improvement with no stated keyword set is not reportable. We covered that discipline in more depth in the guide to white label reporting, and the principle transfers directly to paid media.
A 45 minute Quality Score triage
1. Pull the keyword report with the right columns. Quality Score, expected CTR, ad relevance, landing page experience, impressions, cost, conversions, match type. Last 30 to 90 days depending on volume.
2. Sort by cost, not by score. A 2/10 keyword that spent $14 last quarter is a curiosity. A 5/10 keyword that spent $9,000 is the meeting. Cost ordering is what keeps a triage from becoming a cleanup.
3. Cut everything below meaningful volume. Keywords without enough impressions to have earned a stable rating are noise. Set a floor and stick to it.
4. Split by match type before reading anything. Judge broad match against broad match. Comparing a broad term to an exact term tells you about Google's data model, not about your account.
5. Read the sub-ratings, never the composite. The 1 to 10 does not tell you what to do. Below average ad relevance means restructure the ad group. Below average expected CTR means rewrite the ad and wait. Below average landing page experience means the destination, not the ad.
6. Group the failures by cause, not by keyword. Twelve keywords with Below average ad relevance in the same ad group are one problem with one fix. Fixing them individually is how a 45 minute triage becomes a lost afternoon.
7. Write the hypothesis before you change anything. One line per fix: what you are changing, which sub-rating you expect to move, and roughly when. Without that line you cannot tell later whether the change worked or the account simply drifted.
8. Set a re-check date. Expected CTR needs impression volume to recalculate. Checking in four days produces a false negative and usually a second unnecessary change on top of the first.
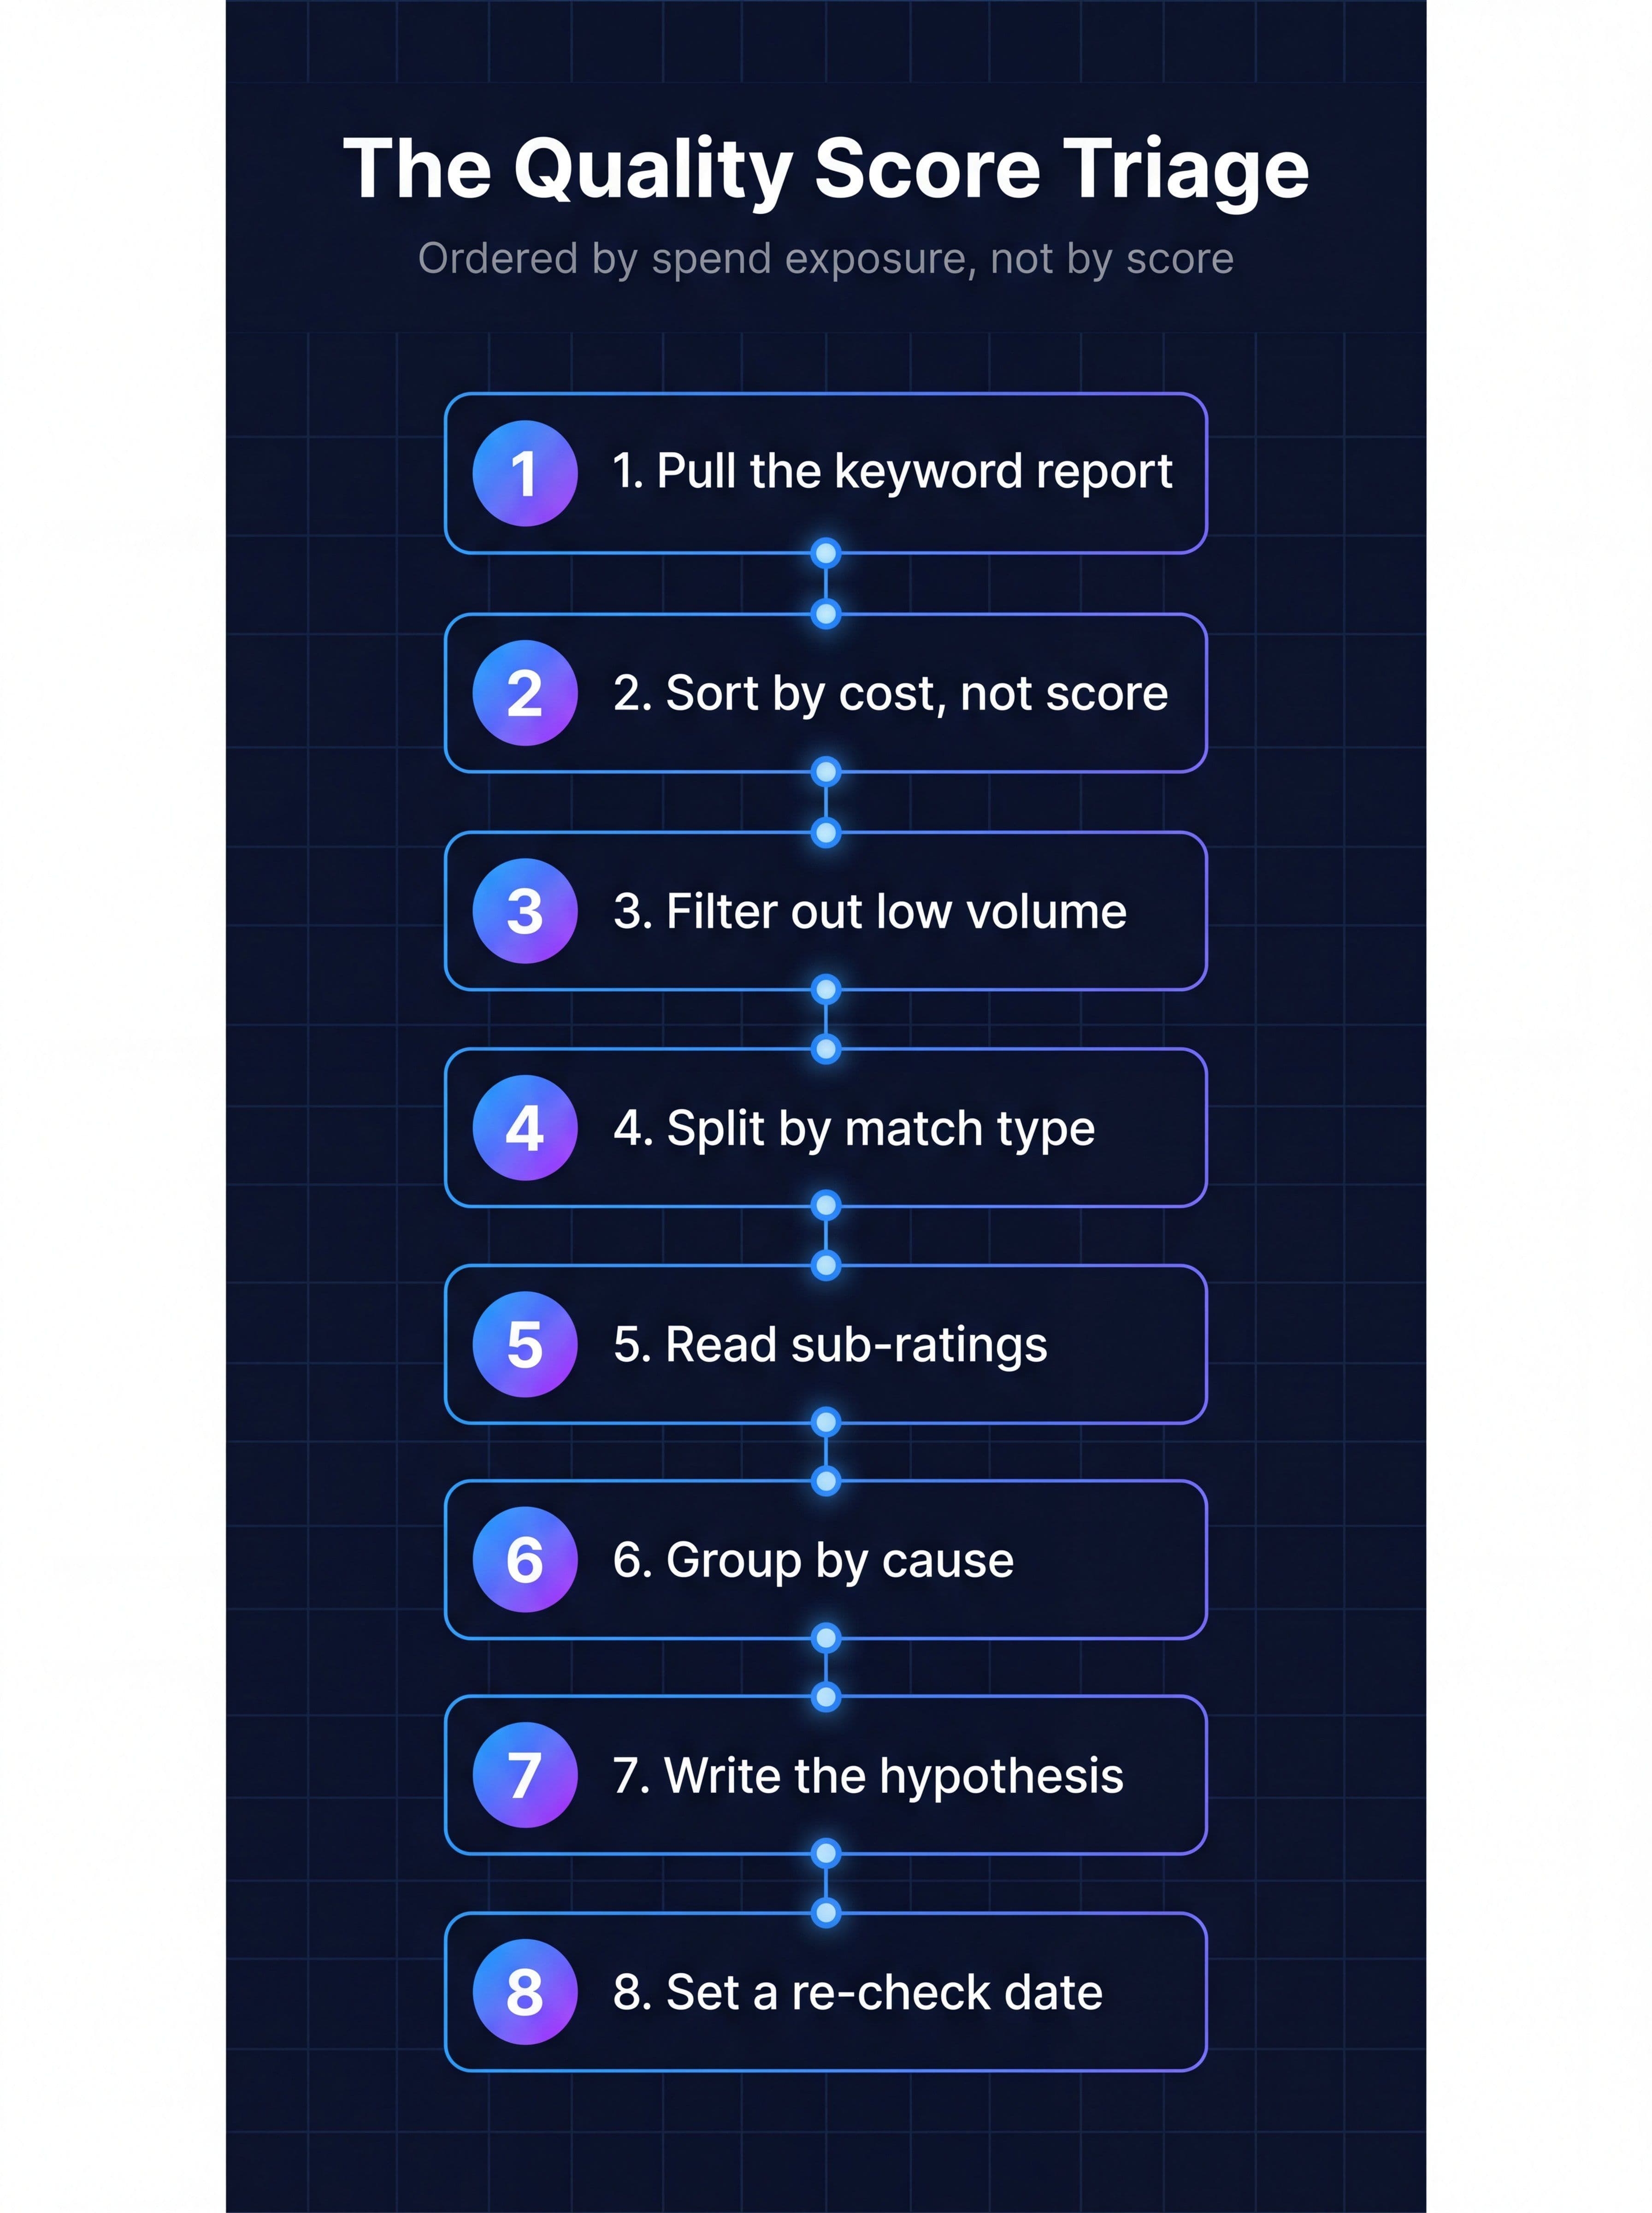
The Quality Score triage, ordered by spend exposure rather than by score.
Run this monthly, not weekly. Quality Score moves slowly by design, and a weekly cadence mostly produces changes made on top of changes that had not finished landing yet. The search terms review is the weekly job. Quality Score is the monthly one.
Landing page experience is the component that moved in 2026
Of the three components, landing page experience is the one where the evaluation has visibly deepened. As Google's AI-driven campaign features assess destination content more thoroughly to decide placement and relevance, the page has become a bigger share of the quality picture rather than a checkbox at the end of it.
What consistently shows up in the guidance as moving the rating:
- Message match. The page repeats the promise the ad made, in the language the ad made it. This is the single most cited factor and the one most often broken by sending traffic to a generic homepage.
- Navigation clarity. A visitor can tell within a few seconds what the page is for and what to do next.
- Transparency. Clear information about the business, what the offer includes, and how data is handled.
- Speed and mobile rendering. Slow pages and layout shift suppress the rating and the conversion rate together.
- No disruptive interstitials. Full-screen overlays on arrival work against you on both the ad and organic side.
The speed half of this overlaps almost entirely with technical SEO work you may already have queued. Core Web Vitals fixes, render-blocking cleanup and image handling improve landing page experience, organic rankings and conversion rate from the same effort. Our technical SEO audit checklist covers the diagnostic side, and you can run a page through the free SEO and Core Web Vitals audit to get the current state before you brief a developer.
The conversion side deserves its own pass. A page can earn an Above average rating and still convert badly, because Google is rating usefulness and relevance rather than persuasion. Treat the rating as a floor to clear, then work the page against your own funnel data using the approaches in our roundup of conversion rate optimization tools.
When Quality Score and performance disagree
Sooner or later you will find a keyword with a 4/10 that is one of the most profitable terms in the account, or an 8/10 that converts nobody. Both are normal and both mean something specific.
| What you see | Most likely explanation | What to do |
|---|---|---|
| Low score, strong conversions | Score is built on thin or mismatched historical data, common on broad match | Nothing. Document why, so the next person does not "fix" it |
| High score, weak conversions | Relevance is fine, the offer or the page's persuasion is not | CRO work, not ad work |
| Score drops with no changes made | Competitive set shifted, or auction-time quality estimates moved | Check impression share and auction insights before touching ads |
| Score flat after a good fix | Expected CTR has not accumulated enough volume to recalculate | Wait. Re-check on the date you already set |
| Whole account drops at once | Site-wide change, tracking break, or a page speed regression | Treat as an incident, not an optimization |
That last row is worth building an alert for. A simultaneous account-wide movement in any quality signal is almost never an ad copy issue, and the sooner it is separated from routine optimization the cheaper it is. Our Google Ads anomaly detection guide walks through setting the thresholds so a genuine regression surfaces before the monthly review does.
The same logic applies to bidding. If you are running automated bid strategies, quality signals feed the model's cost estimates, but the strategy is optimizing to your conversion target rather than to your Quality Score. Changing both at once makes the result unreadable, which is a specific case of the general problem covered in our piece on smart bidding.
How to put Quality Score in a client report without overclaiming
Quality Score is one of the most frequently misreported numbers in agency PPC reporting, and the reason is understandable. It goes up, it looks like a scoreboard, and it is easy to present. But three specific claims about it are not supportable.
"We raised your Quality Score, which lowered your CPC." The stored score did not lower anything, because it is not an auction input. The underlying quality signals may well have. The causal chain as stated is wrong.
"Your account Quality Score improved from 5.2 to 6.4." Unweighted averages move when low-volume keywords enter or leave the account. Without a stated weighting method and a stable keyword set, this is a number that changed rather than a result you produced.
"Quality Score is up, so the campaign is working." Quality Score is a diagnostic. Conversions, cost per acquisition and revenue are results. Presenting the diagnostic as the result is what erodes trust when someone eventually asks what it bought them.
The distinction being drawn there is the difference between a verified claim, a claim that needs context, and an unsupported one. Applying that test to every line of a report is slower than writing the flattering version, and it is the reason the flattering version stops being necessary. If you are rebuilding how you present paid media results, our guide to choosing marketing KPIs covers which metrics belong in the results section and which belong in diagnostics.
Where MarqOps fits
MarqOps is the evidence layer for marketing operations. It connects to Google Ads, GA4 and Search Console, and it checks the claims in a client report against the source data before the report is delivered. Every material statement gets traced back to where the number came from and held for human approval.
For Quality Score specifically, that matters in a narrow and useful way. The claim "we improved Quality Score and cut your CPC" is exactly the kind of statement that reads as verified and is not. It is a correlation presented as a cause, and it is the sort of thing MarqOps flags as needing context rather than letting it ship. The Ad Ops module handles the diagnostic half, with traffic-light campaign risk analysis, search-term review and recommendations you can act on or reject with the reasoning attached.
If you want to see what a claim-checked paid media report looks like before connecting anything, the interactive sample shows the verified, needs-context and unsupported states on real report language. If you are still comparing options, our PPC management tools comparison is honest about where MarqOps is not the right answer.
Frequently asked questions
What is a good Google Ads Quality Score?
Seven or above is generally considered good, and it already places you ahead of the reported average of 5 to 6 across large account samples. Chasing 10 across an account is usually a poor use of time. The better target is 8 or above on the small set of keywords carrying most of your spend, and no Below average sub-ratings on anything expensive.
Does Quality Score still matter in 2026?
The components matter and the stored number is a diagnostic. Google states the visible Quality Score is not used in the auction, while Ad Rank uses real-time estimates of the same three signals. So expected CTR, ad relevance and landing page experience still drive what you pay. The 1 to 10 figure just tells you where to look, and in automation-heavy accounts it tells you less than it used to.
How do I improve Quality Score quickly?
Ad relevance is the fastest component to move, often within days, and the usual fix is structural rather than creative. Split oversized ad groups so each one covers a single tight theme, then write ad copy that repeats the keyword's language. Expected CTR takes longer because it needs impression volume to recalculate, and landing page experience takes longest of all but holds the longest.
Why is my broad match Quality Score so low?
Because the score is an aggregated estimate built largely on past exact match performance, and broad match keywords generate a different kind of history. It is common to see broad terms sitting at 2 or 3 while phrase and exact match look healthy in the same ad group with the same landing page. If the campaign is hitting its targets, that pattern reflects a data gap rather than a quality failure.
Is there a Quality Score in Performance Max?
No. Performance Max does not expose keyword-level Quality Score, because it does not run on a keyword list you control. Quality control there moves to asset strength ratings, audience signals, brand exclusions, campaign-level negatives and whatever search category data the campaign reports. The underlying idea is the same: relevance and destination quality still shape what you pay.
How is impression-weighted Quality Score calculated?
Multiply each keyword's Quality Score by its impressions, sum that column, then divide by total impressions. This stops a low-volume 1/10 from dragging down an account average as hard as a high-volume 10/10 pushes it up. Run the same calculation at campaign and ad group level, and consider a cost-weighted version alongside it to see where money rather than visibility is exposed.
Can a low Quality Score keyword still be profitable?
Frequently, especially on broad match. Quality Score does not measure conversion value or margin, and it says nothing about whether the traffic is worth what it costs. If a low-scoring keyword is converting at an acceptable cost per acquisition, leave it alone and write down why, so it does not get paused in the next cleanup by someone reading the score in isolation.
How often should I review Quality Score?
Monthly is enough for most accounts. The score updates on aggregated history, so weekly reviews mostly produce changes stacked on top of changes that have not finished registering. The weekly cadence belongs to the search terms report, where new queries appear constantly. Set the exception for account-wide movements, which should trigger an alert regardless of the review schedule.
The bottom line
Quality Score has quietly changed jobs. It used to be a scoreboard people optimized toward. It is now a symptom reader for three signals that still shape what you pay, reported as an aggregate that increasingly describes a shrinking, keyword-shaped part of your account.
That makes the practical advice fairly short. Read the sub-ratings rather than the composite. Weight any average you calculate, and say which weighting you used. Sort by cost so you fix the expensive problems first. Segment by match type before you conclude anything, because broad match scores and exact match scores are not the same measurement. Give changes enough time to register before making the next one.
And keep it out of the results section. Quality Score is a good reason to open an ad group and a bad way to tell a client the month went well. The version of that update that survives being questioned is longer, more careful, and traceable to a source. That is the version worth building the habit around, because in an account where a growing share of matching decisions are made by a model rather than by you, the record of what you decided and why is the most durable thing you own.